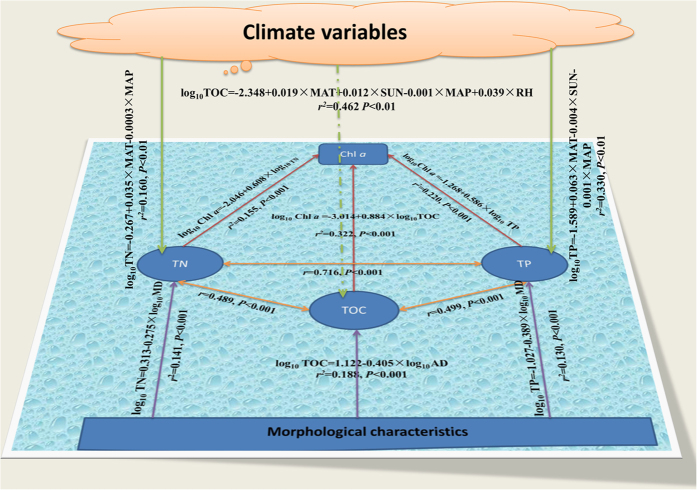
Figure 2. Regression equations relating Chl a (mg L−1) to TOC (mg L−1), TN (mg L−1) and TP (mg L−1) concentrations, and the influence of morphological characteristics and climate variables on these elements in lake water at a global scale.
Chl a, Chlorophyll a; MD, maximum depth (m); AD, average depth (m); MAT, mean annual temperature (°C), MAP, mean annual precipitation (mm); SUN, sunshine (percent of maximum possible); RH, relative humidity (%).

