
Figure 1. Genome-wide distribution of SNPs and recombination bins in chickpea.
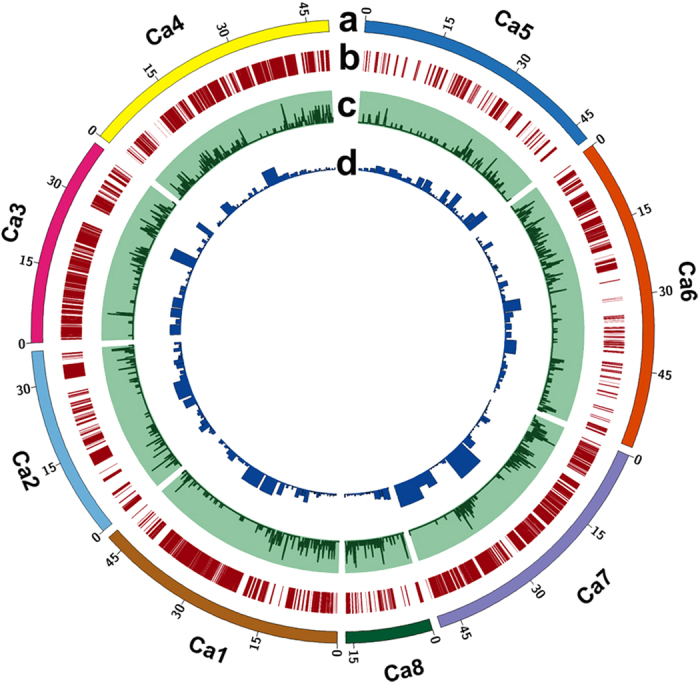
(a) Chickpea pseudomolecules, labelled as Ca1 to Ca8 and each pseudomolecule is shown in a different colour. The numbers on arches represent the scale for the size of pseudomolecules in Mb; (b) Distribution of 53,223 SNPs on eight chickpea pseudomolecules. Each SNP is represented as a single vertical line. The highest number of SNPs (18,989) were identified on Ca4 while the lowest number (954) of SNPs were identified on Ca5. Aggregation of vertical lines indicates SNP dense regions, while SNP sparse regions are depicted by blank spaces. Pseudomolecules Ca1, Ca3, Ca4 and Ca7 were found to contain SNP dense regions, whereas SNP sparse regions were observed on Ca2, Ca5, Ca6 and Ca8 pseudomolecules; (c) Distribution of 1,610 recombination bins on chickpea pseudomolecules. The number of recombination bins within 100 Kb intervals were calculated and plotted as a smooth line curve. The height of the line indicates the number of bins within the respective 100 Kb interval. A flat line corresponds to no or limited recombination regions; (d) Distribution of genes among recombination bins. The number of genes located within each recombination bin were identified by comparing the coordinates of the respective bin with chickpea gene models. The width of the column is proportional to the recombination bin interval while column height is proportional to the number of genes within that interval.