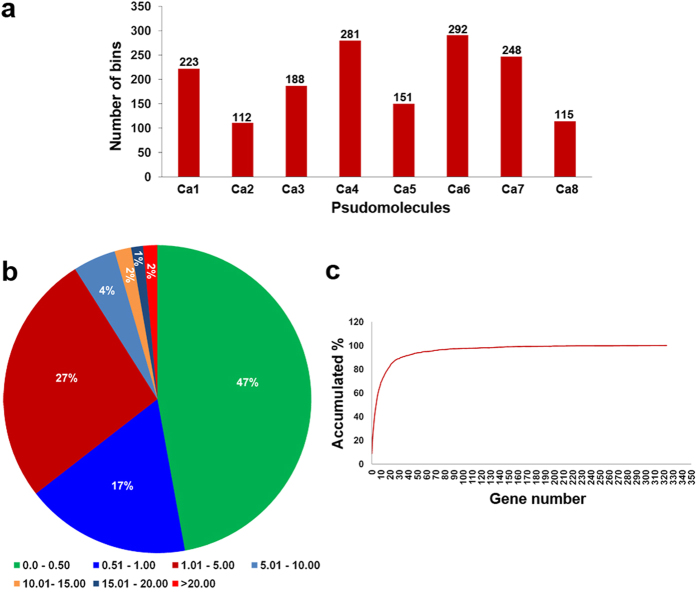
Figure 3. Features of recombination bin mapping in chickpea.
(a) Distribution of the recombination bins on eight chickpea pseudomolecules. The number of recombination bins identified in each psudomolecule was depicted on top of each column. A minimum of 112 bins were identified on Ca2 while maximum 292 bins were identified on Ca6.; (b) Distribution of bin sizes identified in ICC 4958 × ICC 1882 population. Approximately, 50% of the bins were of ≤0.50 Mb size indicating majority of the recombination has been captured; (c) A plot of gene resolution. Number of genes in each recombination bin represented on the X-axis and the accumulated percentage of bins are on the Y-axis. In total, 8.68% (139) bins contained no gene, 14.29% (229) had only one gene, while 45.82% (734) had two to ten genes. Thus, 68.79% of bins had ≤10 genes.

