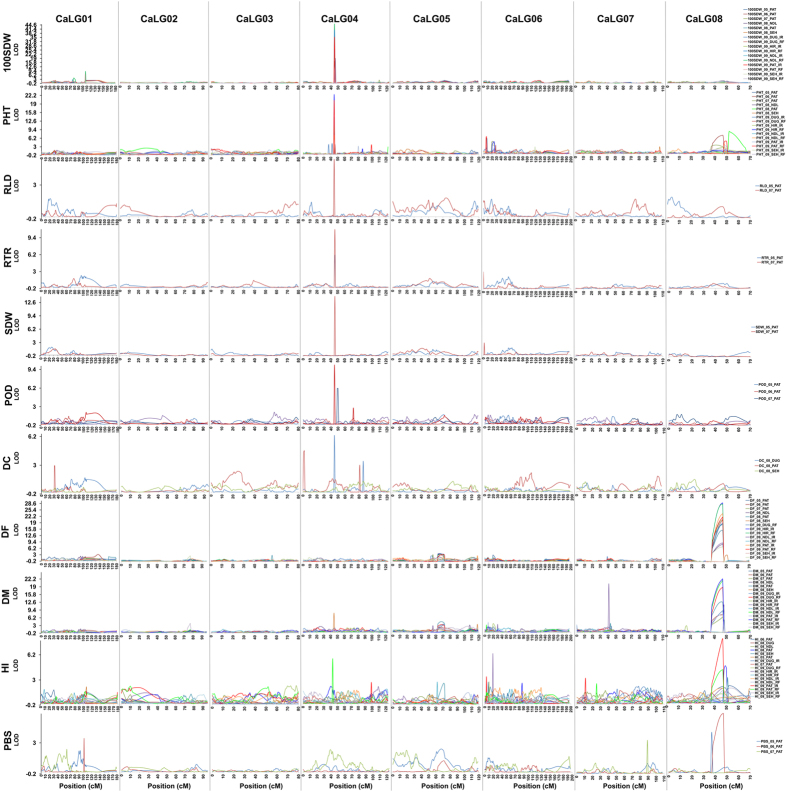
Figure 4. Genome-wide distribution of major QTLs identified for 11 traits.
A total of 71 major QTLs identified for 11 traits (root length density (RLD, cm cm−3), root dry weight/total plant dry weight ratio (RTR, %), shoot dry weight (SDW, g), plant height (PHT, cm), primary branches (PBS), days to 50% flowering (DF), days to maturity (DM), pods/plant (POD), 100-seed weight (100SDW, g), harvest index (HI, %) and delta carbon ratio (DC)) have been shown. The linkage groups are separated by vertical lines, genetic distance is represented on the X-axis and LOD values are represented on Y-axis. Different coloured lines for each trait represent the phenotypic data collected over 1–5 seasons, 1–5 locations (Patancheru-PAT, Hiriyur-HIR, Nandyal-NDL, Durgapura-DUG and Sehore-SEH) and two environments (Rainfed-RF and Irrigated-IR). Major QTLs for 100SDW, PHT, RLD, RTR, SDW, POD and DC were identified on CaLG04; however, for traits like DF, DM, HI, and PBS major QTLs were identified on CaLG08.

