
Figure 3. Simulated global attack rate D∞/V as a two-dimensional function of the mobility rate p and the transmissibility λ for different mobility network structures characterized by θ = 0.5 (A) and θ = −0.4 (B).
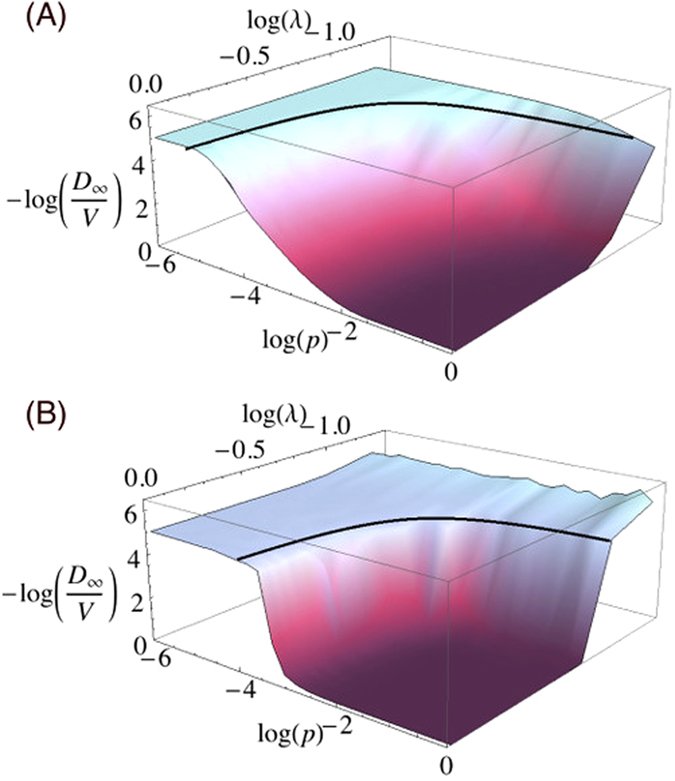
Black solid lines indicate the analytical predictions for the critical values of p and λ corresponding to R* = 1. Here the network parameters are the same as in Fig. 2 and η = 0.12. Each point of the phase-space is averaged over 2 × 10³ simulations. To facilitate the visual comparison between the simulations and the analytical solutions we plot the z-axis considering the negative log10 of D∞/V.