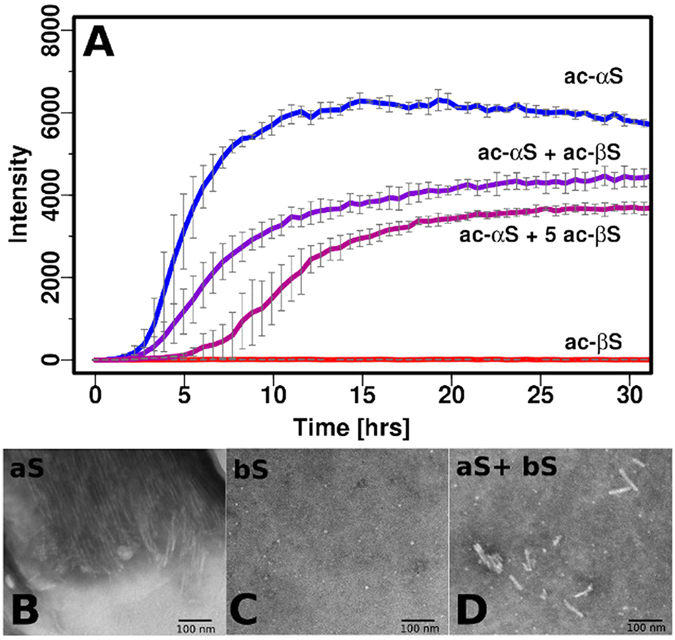
Figure 2. Aggregation inhibiton of αS by βS as monitored by ThT and TEM.

(A) ThT fibrillation assay curves of: αS alone (blue), βS alone (blue), αS+βS 1:1 mixture (violet), αS+βS 1:5 mixture (magenta) Experimenal conditions: 10 mM MES, pH 6, 70 μM protein. The experiment was performed in triplicate at 37 °C with shaking with teflon beads and average values were plotted with associated error bars. The buffer conditions matched the conditions of NMR PRE expreriments. Negatively stained electron micrographs (scale 100 nm) of end products of the ThT fibrillation assay of: (B) αS (C) βS (D) αS co-incubated with βS, ratio 1:1.
