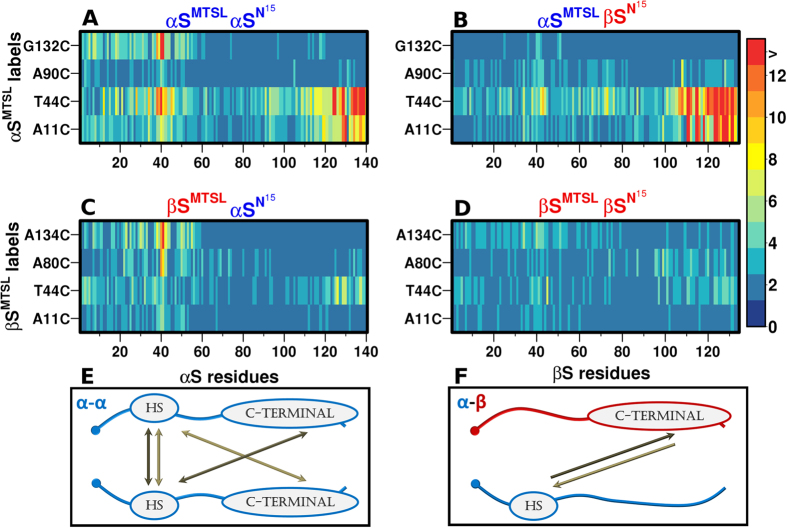
Figure 3. Contact maps of αS/αS homo-dimers and αS/βS hetero-dimers show distinctive interaction profiles.
Contact maps of transient dimers, shown as heat maps where each strip represents the color coded value of the residue-specific inter-chain paramagnetic relaxation enhancement rate (PRE rate-HNΓ2) induced by the proximity of the MTSL label to the residues in the indicated protein. Contact maps (A–D): figures A-D show four heat maps for all possible permutations of the spin label and NMR detectable chains of αS and βS: (A) 14N-αS-MTSL/15N-αS, (B) 14N-αS-MTSL/15N-βS, (C) 14N-βS-MTSL/15N-αS, (D) 14N-βS-MTSL/15N-βS. Contact maps show the PRE values colored in accordance with the legend; residues that do not exhibit interactions are colored blue and interactions higher than 12 Hz are colored red. Each strip on the contact maps corresponds to the spin label (y-axis). In one strip there are bins which correspond to the residue number on the NMR visible chain (x-axis). (E,F) Schematic representations of possible interactions of homo αS/ αS and hetero- αS/βS synuclein dimers. (E) αS/αS corresponds to interactions from the contact map (A,F) αS/βS corresponds to contact map (B,C); no homo-dimer for βS is shown as we observe no inter-chain interactions between βS chains. HS in the schematic stands for interactive “Hot Spot”. The hot spot size is defined based on the interactivity of the regions as shown in Supplementary Fig. 4A. Hot spot encompasses residues 38–45.

