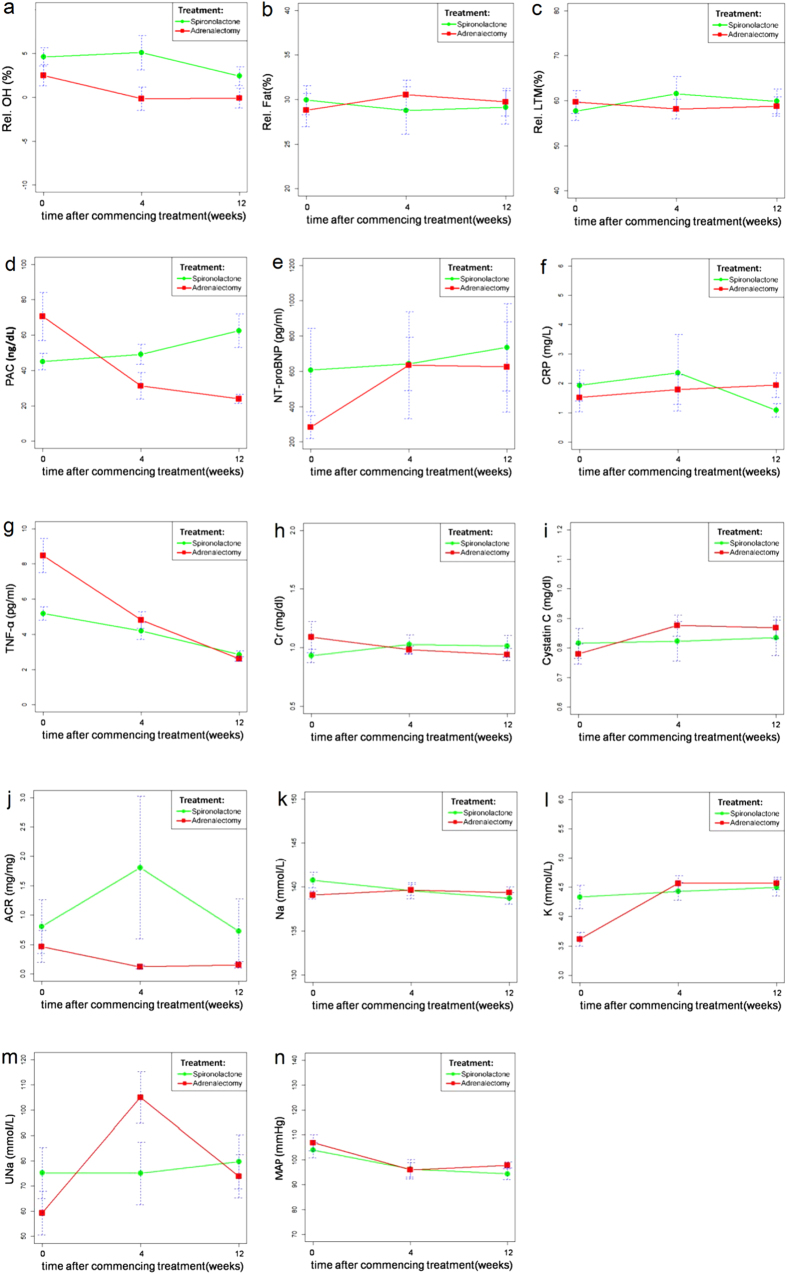
Figure 3. Generalized estimating equations to examine the effect of different treatment strategies on various time-sequential variables.
Panels a-c: BCM parameters; Panels d-g: hormones and biomarkers; and Panels h-n: renal parameters. (a) The Relative overhydration (Rel. OH) between group, p = 0.062. Changes in time period contributed to changes in Rel. OH after 4 weeks (p = 0.011). Rel. OH was significantly different at 12 weeks (p = 0.008). (b) The Relative fat (Rel. Fat) between group, p = 0.034. Changes in time period contributed to changes in Rel. Fat after 4 weeks (p = 0.0105). (c) The Relative lean tissue mass (Rel. LTM) between group, p = 0.73. (d) The plasma aldosterone concentration (PAC) between group, p = 0.1942. PAC was significantly different at 4 weeks (p = 0.0034) and 12 weeks (p = 0.001). (e) The N-terminal pro-brain natriuretic peptide (NT-proBNP) between group, p = 0.448. (f) The C-reactive protein (CRP) between groups, p = 0.89. (g) The Tumor necrosis factor-alpha (TNF-α) between groups, p < 0.001. Changes in time period contributed to changes in TNF-α after 4 weeks (p < 0.001). TNF-α was significantly different at 12 weeks (p < 0.001). Changes in time period contributed to changes in TNF-α after 12 weeks (p < 0.001). (h) The serum creatinine (Cr) between groups, p = 0.46. (i)The cystatin C between groups, p = 0.570. (j) The urine albumin-to-creatinine ratio (ACR) between groups, p = 0.607. Changes in time period contributed to changes in ACR after 4 weeks (p = 0.003). (k) The serum sodium (Na) between groups, p = 0.49. (l) The serum potassium (K) between groups, p < 0.001. Changes in time period contributed to changes in K after 4 weeks (p < 0.001). Changes in time period contributed to changes in K after 12 weeks (p < 0.001). (m) The urine sodium (UNa) between groups, p = 0.26674. Changes in time period contributed to changes in UNa after 4 weeks (p < 0.001). (n) The mean arterial blood pressure (MAP) between groups, p = 0.7761. MAP was significantly different at 4 weeks (p = 0.003) and 12 weeks (p < 0.001).

