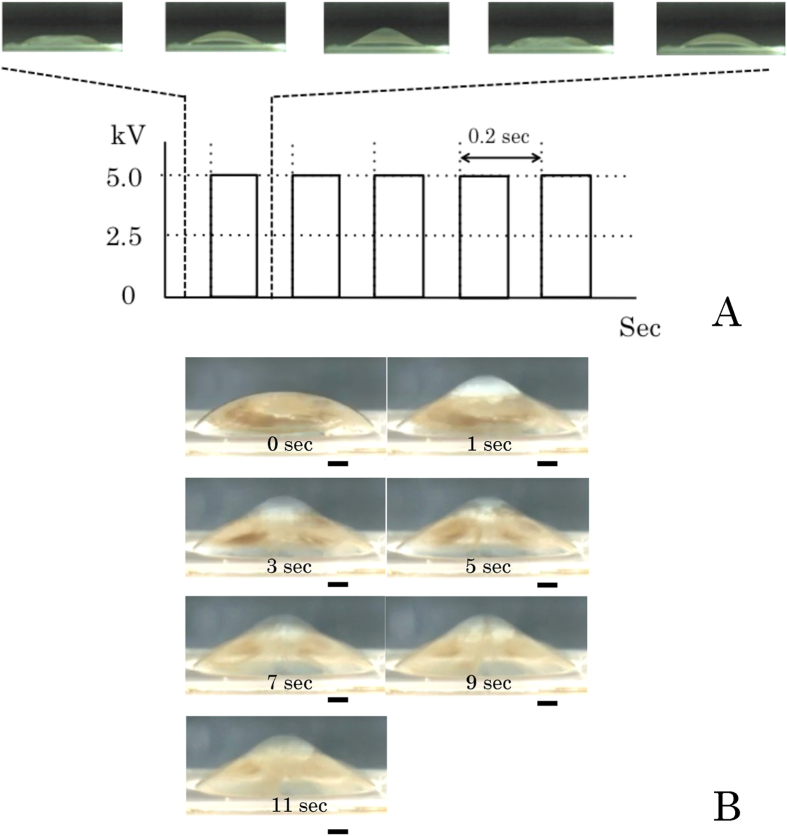
Figure 1.
(A) Changes in the form of the microdroplet as the voltage was switched on and off in a time series. A frequency of 5 Hz is shown as an example. (B) We put 1 μl of FG beads® in 14 μl distilled water and performed AC electric field mixing. Using a high-speed camera, we demonstrated that FG beads® were mixed within the microdroplet. Scale bar: 1 mm.

