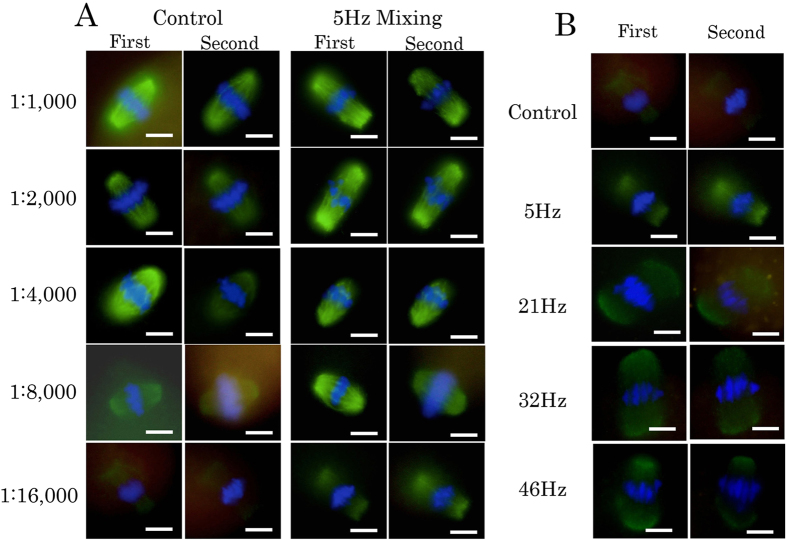
Figure 3.
(A) Comparison between control and AC electric-field mixing at 5 Hz, for each antibody concentration. Immunofluorescence staining of eggs is shown for the first and second observations.(B) Immunofluorescence staining of eggs is shown for the 1:16,000 dilution at each frequency. The second observation was carried out 48 hours after the first observation. Green, microtubules; blue, DAPI. Scale bar: 10 μm.

