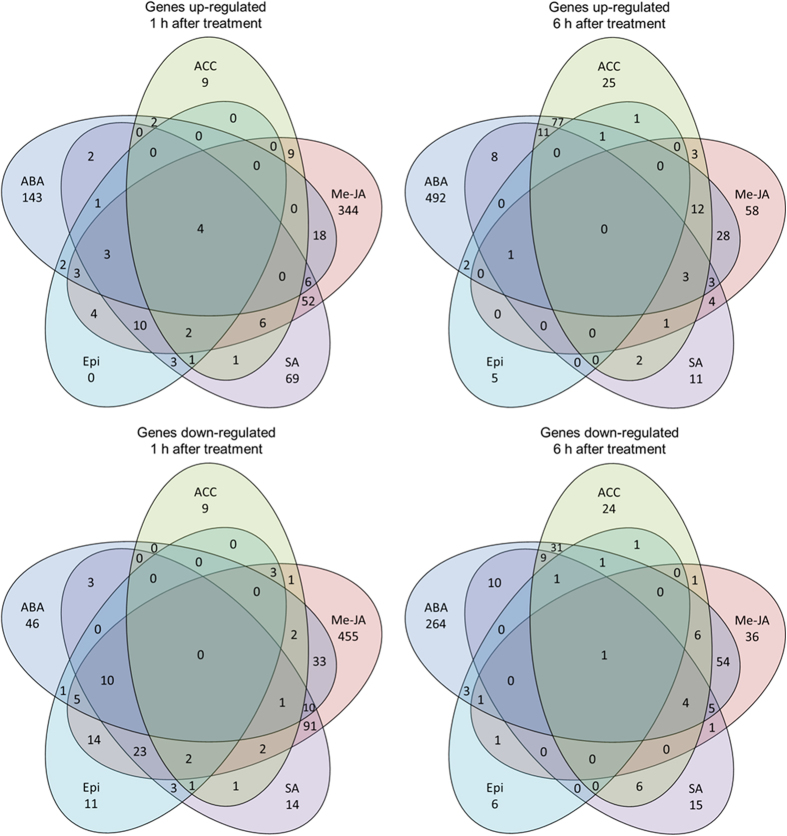
Figure 1. Numbers of genes significantly affected in their expression in hormone treated vs. control plants (p-value ≤ 0.05).
Numbers of genes uniquely affected by one of the hormones and numbers of genes affected by more than one hormone are shown. Only genes that were consistently up- or down-regulated across the treatments were included in this figure. Genes that were effected in opposite direction (e.g. up-regulated by ABA but down-regulated by ACC) are not included. The figure displays genes up-regulated 1 h after treatment, genes down-regulated 1 h after treatment, genes up-regulated 6 h after treatment and genes down-regulated 6 h after treatment. ABA (abscisic acid); ACC (aminocyclopropanecarboxylic acid); Epi (epibrassinolide); Me-JA (methyl jasmonate); SA (salicylic acid).

