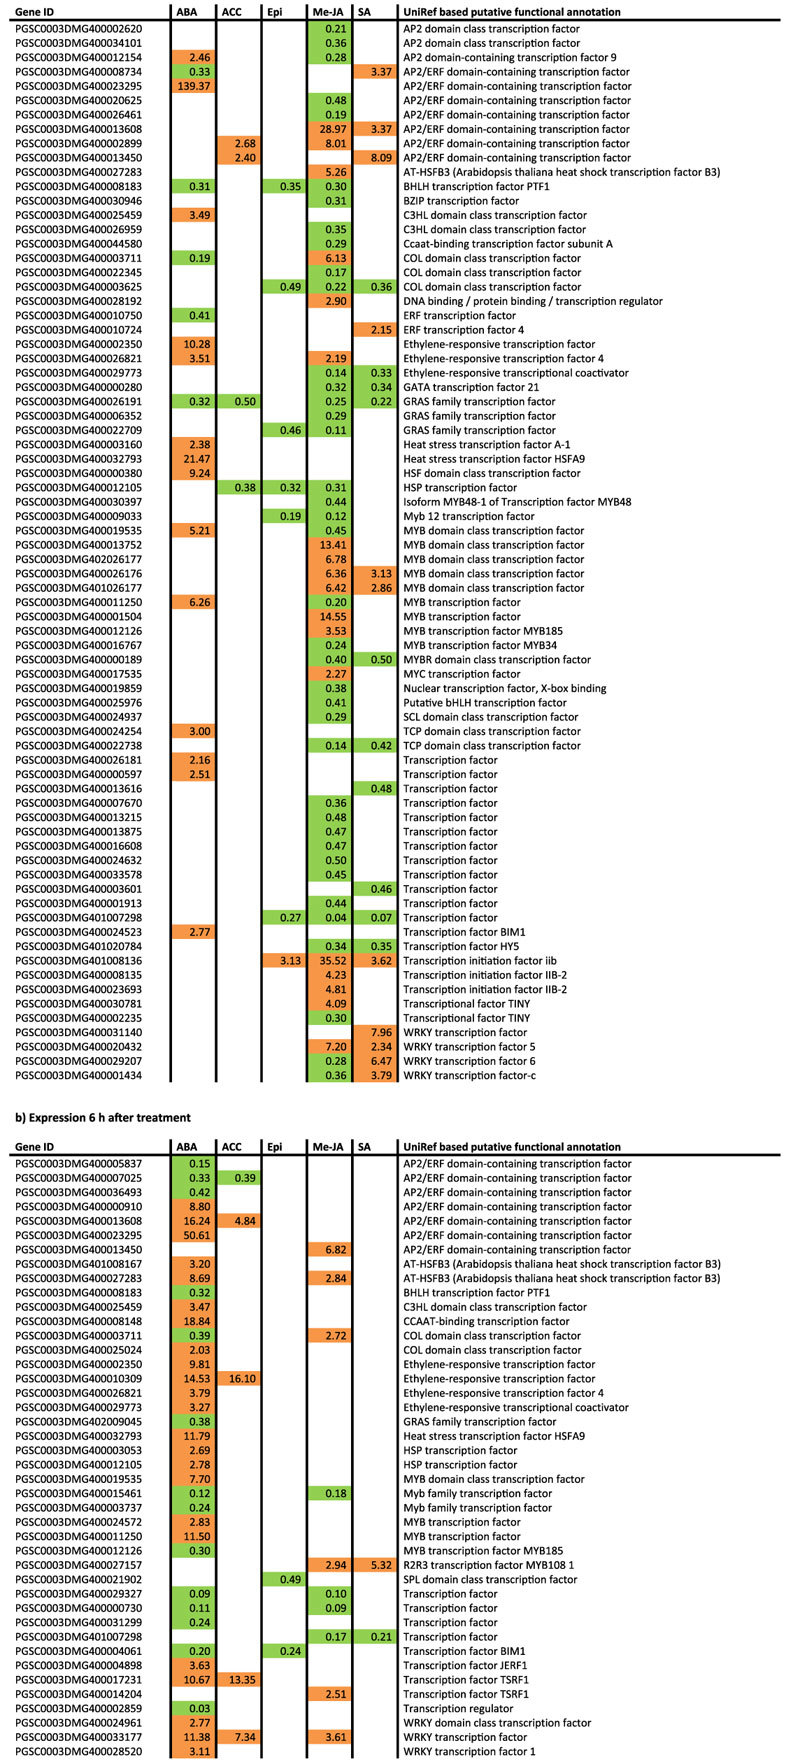
Table 1. Transcription factors (UniRef annotation) that are differentially expressed at 1 h (Table 1a) and 6 h (Table 1b) after hormone treatments are shown.

Values represent fold changes in gene expression in hormone treated plants in comparison to control plants. Up-regulated genes are highlighted in orange, down-regulated genes are highlighted in green. ABA (abscisic acid); ACC (aminocyclopropanecarboxylic acid); Epi (epibrassinolide); Me-JA (methyl jasmonate); SA (salicylic acid).
