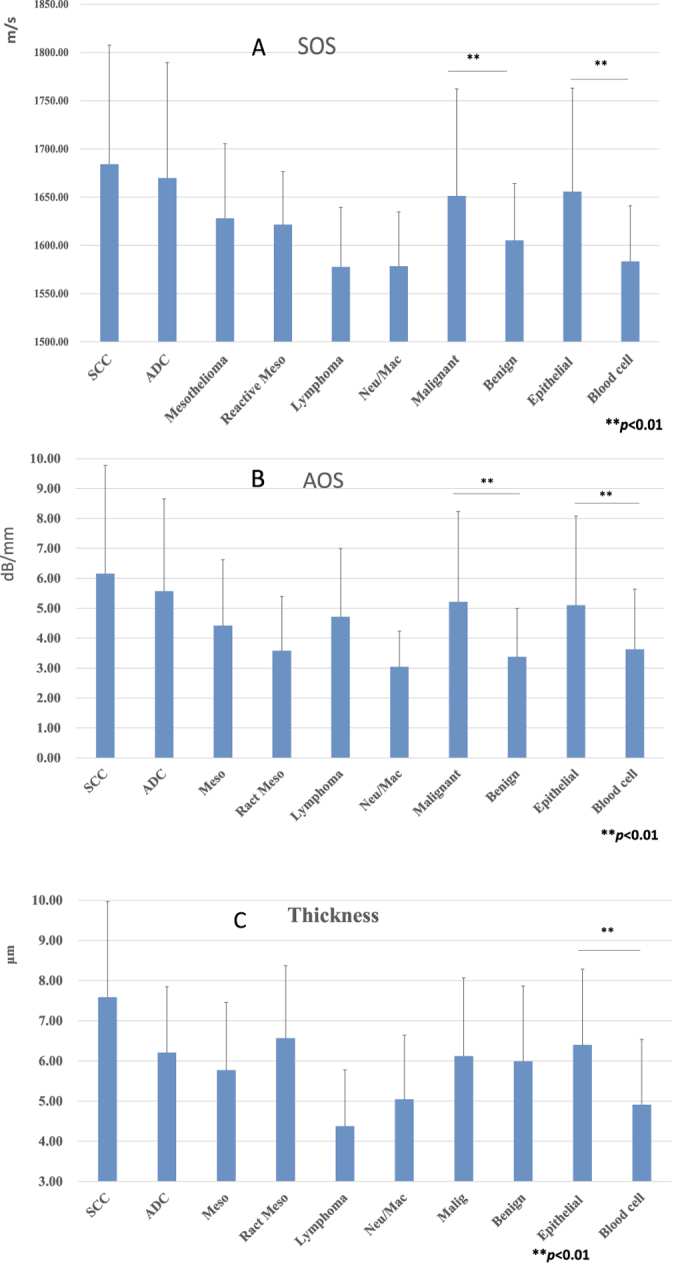
Figure 3. Acoustic values of speed of sound (SOS), attenuation of sound (AOS) and thickness.

(A) There were significant differences in SOS among cell types. The malignant cell group had significantly greater SOS values than those of the benign cell group, whereas the epithelial group had higher SOS values than the blood cell group (P < 0.01). (B) There were significant differences in AOS among cell types. The AOS values of the malignant and epithelial cell groups were significantly greater than those of the benign and blood cell groups, respectively (P < 0.01). (C) The cell thicknesses differed among each cell type. Generally, thicker cells had a higher SOS and AOS. The epithelial cell group was significantly thicker than the blood group, but there was no significant difference between the malignant and benign groups (P < 0.01). SCC, squamous cell carcinoma; ADC, adenocarcinoma; Meso, mesothelioma; React Meso, reactive mesothel; Neu/Mac, neutrophil/macrophage.
