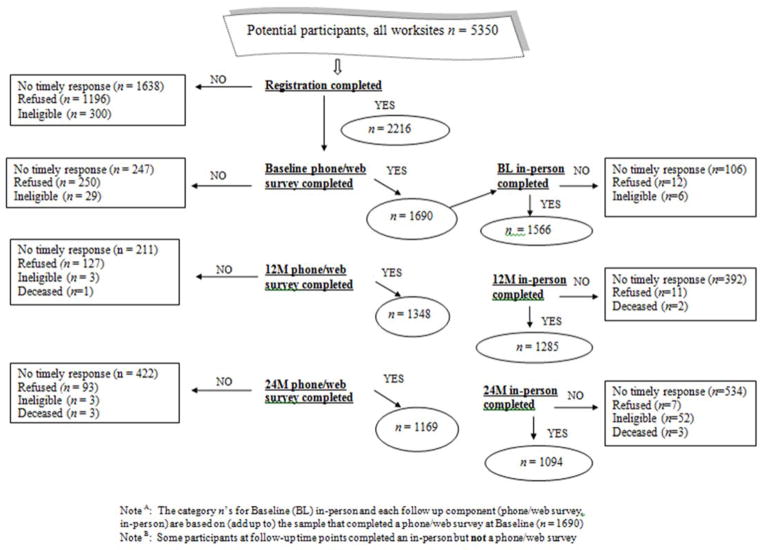
Figure 1. Cohort recruitment and retention diagram.
Note A: The category n’s for Baseline (BL) in-person and each follow up component (phone/web survey, in-person) are based on (add up to) the sample that completed a phone/web survey at Baseline (n = 1690)
Note B: Some participants at follow-up time points completed an in-person but not a phone/web survey

