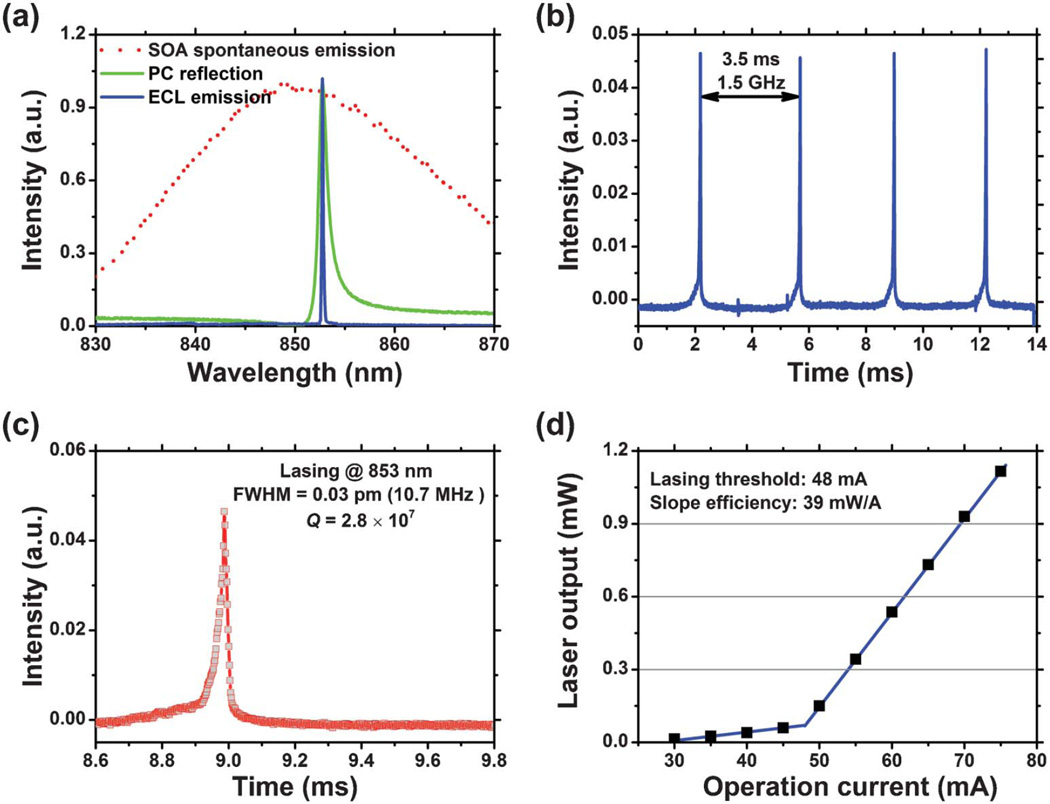
Fig. 2.
Lasing characterization. (a) Overlaid SOA spontaneous emission spectrum, PC resonant reflection spectrum, and ECL single-mode emission spectrum. The red dotted curve displays the spontaneous emission spectrum of the SOA obtained under an injection current of 56 mA at 20 °C. The green curve represents the PC resonant reflection spectrum and the blue curve denotes the ECL lasing spectrum. (b) (c) Interferogram. ECL emission spectrum measured using a scanning Fabry-Perot interferometer with 7.5 MHz resolution. (b) FSR Plot. Knowing the FSR of the interferometer is 1.5 GHz, the calibration factor is found by setting 1.5 GHz = 3.5 ms (428.57 MHz ms−1), the distance between the two peaks. With the oscilloscope timebase calibrated, the FWHM of the laser emission is determined to be 0.025 ms 6 428.57 MHz ms−1 = 10.71 MHz, which corresponds to an FWHM = 0.03 pm in wavelength. (c) This shows a close-up of the actual signal of the laser, which results from the convolution of the laser linewidth and finesse of the interferometer FP cavity. (d) The light vs. current (L.I.) curve associated with the external cavity laser. Using a linear least-squares fit to the emission fluence above threshold, clear threshold current of 48 mA and slope efficiency of 39 mW A−1 are found.

