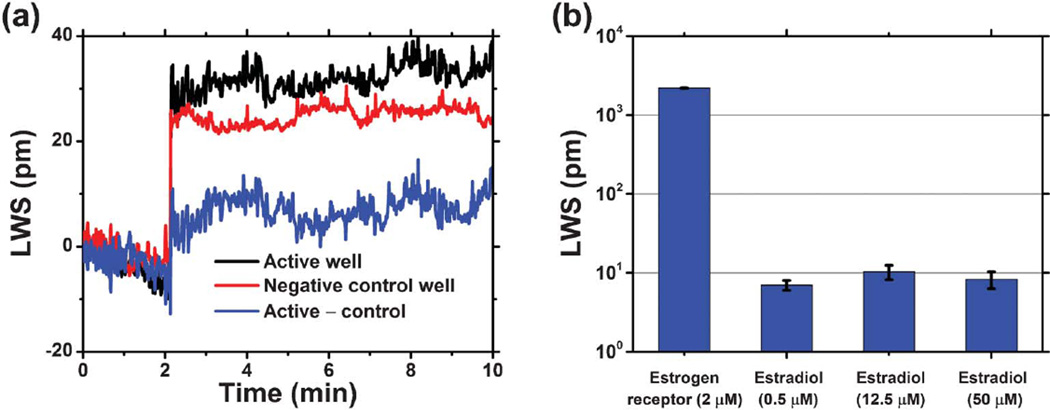
Fig. 5.
Drug-like small molecule detection: exploration of the estradiol-estrogen receptor binding. (a) Black curve represents the laser sensor’s response to the addition of estradiol (50 µM in 1% DMSO solution) to the estrogen-receptor coated sensor well (half filled with PBS), while the red curve denotes the sensor’s response in the control well, where the same estradiol solution was added to a glutaraldehyde-coated sensor surface (half filled with PBS). After subtracting the shifts due to the solution bulk RI change and non-specific binding, the dynamic binding of estradiol to the estrogen-receptor on the sensor’s surface is shown in the blue curve. (b) Lasing wavelength shifts for immobilized ER, exposed to 0.5 µM, 12.5 µM, and 50 µM estradiol concentrations. All of the measured LWS represent the net shifts after referencing to negative controls, with error bars indicating the standard deviation of lasing wavelength values within individual sensor wells.

