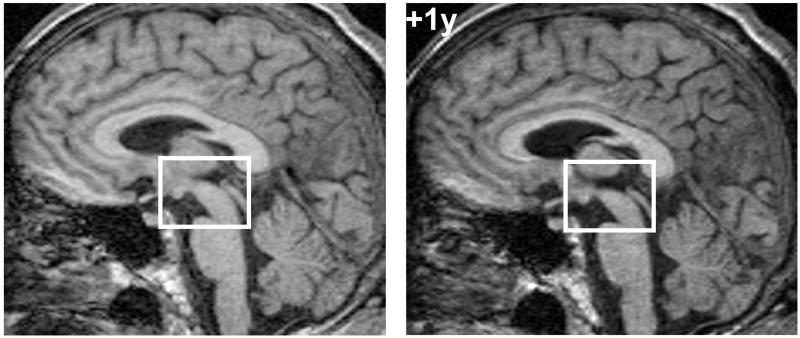
Figure 1. MRI brain showing selective midbrain atrophy.
Sagittal T1-weighted volumetric MRI sections of the patient’s brain five years after symptom onset (left) and one year later (+1y), showing relatively selective midbrain atrophy. Images have been registered into a common space for comparison (the bounding box is provided to aid visualisation of midbrain change).

