Figure 3.
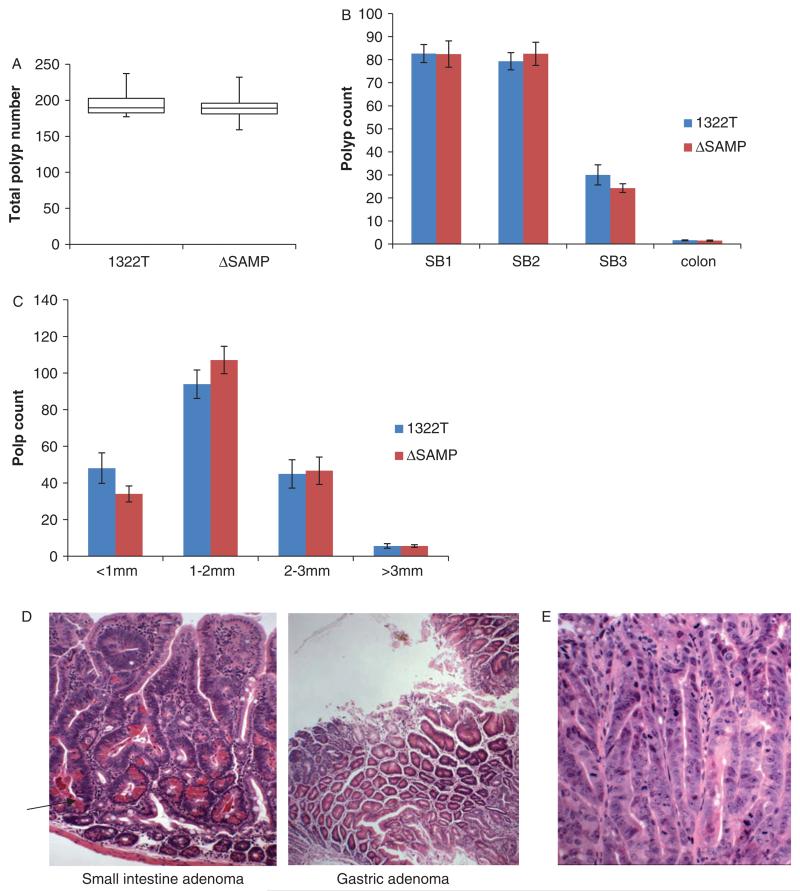
The gross intestinal polyposis phenotype of ΔSAMP mice is indistinguishable from 1322T mice. (A) Box plot showing that the total polyp number found in 1322T (n = 12) and ΔSAMP (n = 10) mice is similar. (B) Graph showing the same distribution of polyps between the regions of the small intestine and colon in the two strains. (C) Bar chart showing the size of polyps in the small intestine in the two strains, (D) H&E staining showing a typical ΔSAMP small intestine adenoma with high numbers of Paneth cells (arrow) and a gastric adenoma. (E) Severely dysplastic areas in a ΔSAMP adenoma.

