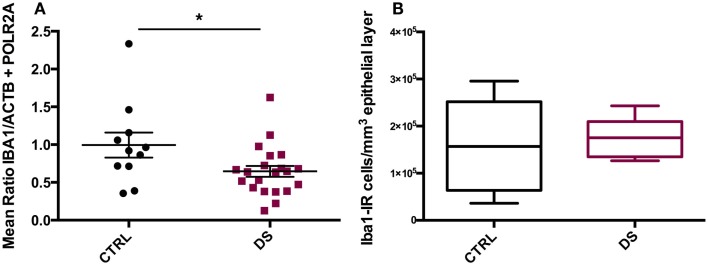
Figure 4.
IBA1 gene expression and immunohistochemical distribution. (A) Absolute expression of IBA1 RNA transcript in the choroid plexus of psychiatrically healthy controls (CTRL) and depressed suicides (DS). DS expressed significantly less IBA1 than CTRL subjects; p = 0.032. Values are reported as the mean ratio of IBA1 expression to the geometric mean expression of endogenous control genes ACTB and POLR2A. (B) Quantification of Iba1-IR cells in the choroid plexus epithelial layer of CTRL and DS. No significant difference in epithelial layer Iba1-IR cell number was observed between groups; p > 0.10.

