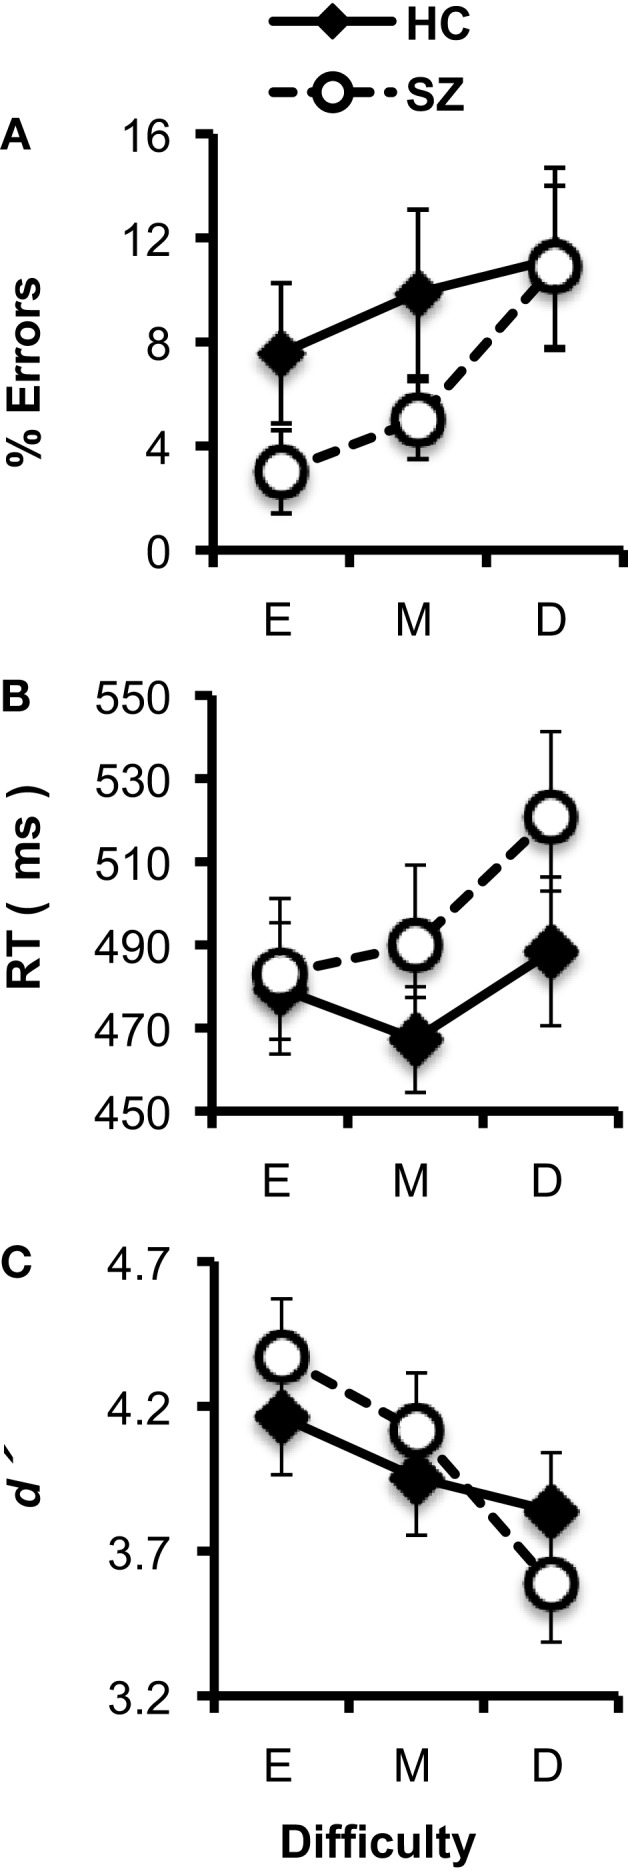
Figure 2.

Task performance data (error bars indicate SE) for the healthy control (HC) and schizophrenia patient (SZ) groups in the three experimental conditions (E: Easy; M; Medium; D: Difficult). (A) Error rates. (B) Median reaction time (RT). (C)d′.
