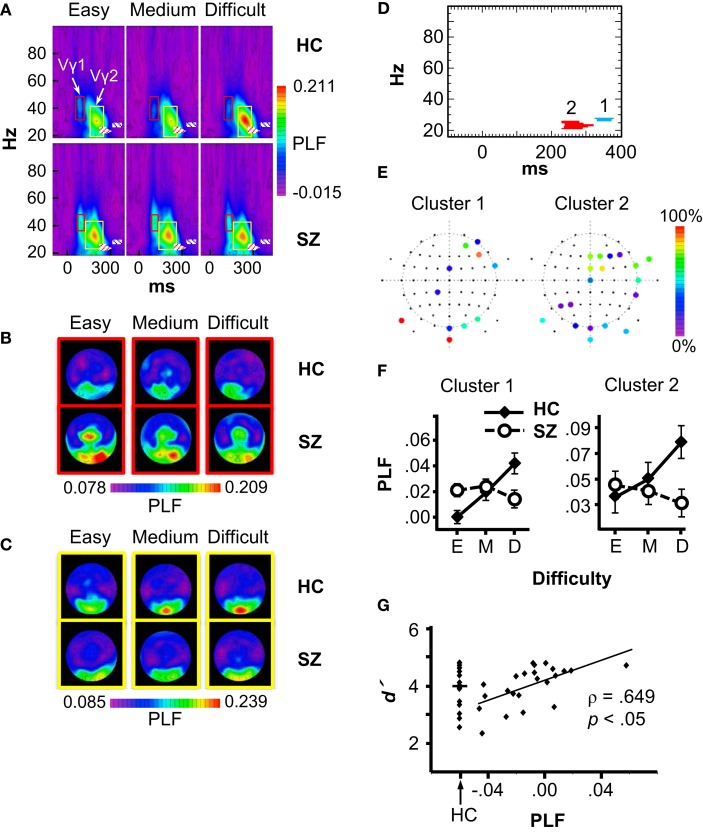
Figure 4.
Phase-locking factor (PLF) data. (A) Grand average time-frequency (TF) PLF maps for the HC and SZ groups in each Difficulty condition. TF maps were averaged across all scalp electrodes. Boxes indicate the ranges in which the Vγ1 (red boxes) and Vγ2 (yellow boxes) oscillations were measured. Crosshatched boxes represent Cluster 1 (blue) and Cluster 2 (red) derived from statistical non-parametric mapping. (B) Topography of Vγ1 in each condition and group. (C) Topography of Vγ2 in each condition and group. (D) Statistical non-parametric mapping results showing the two Group × Difficulty PLF clusters (Cluster 1: 328–377 ms, 26–27 Hz; Cluster 2: 232–320 ms, 21–25 Hz). (E) Cluster topographies. The color scale indicates the percentage of the cluster to which each electrode contributed. (F) PLF values for each cluster in three difficulty conditions (E: Easy; M: Medium; D: Difficult). (G) Scatterplot of the correlation between the Cluster 1 Difficulty effect (Difficult minus Easy PLF) and overall d′ in the SZ group. The distribution of d′ values for HC is shown for comparison.

