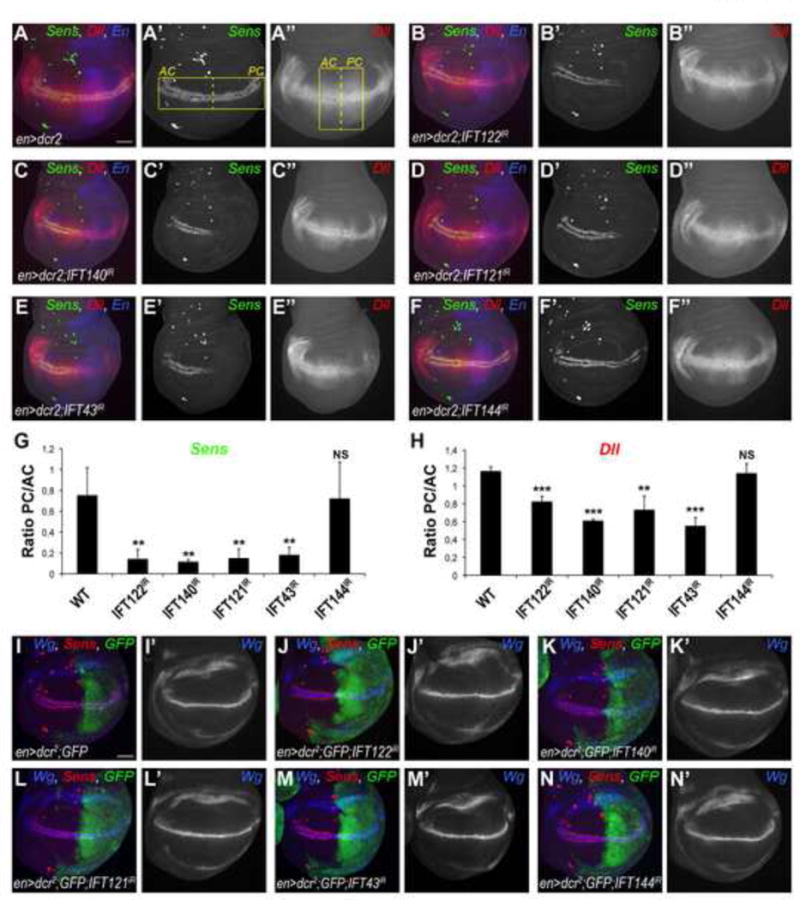
Figure 2. Wg-specific markers are disrupted by knockdown of a subset of IFT-A components.

(A–A″) Wt expression pattern of Sens (green, monochrome in A′) and Dll (red, monochrome in A″) in 3rd instar wing imaginal discs of en> flies. en compartment (posterior) is marked in blue (A). Yellow rectangles in (A′) and (A″) indicate the areas used for quantifications of fluorescence intensity of Sens and Dll stainings (see G and H for graphs). (B–F) Sens staining is largely lost and Dll staining is reduced in en-driven RNAi based knockdowns of IFT122IR (B–B″), IFT140IR (C–C″), IFT121IR (D–D″), and IFT43IR (E–E″) at 29°C, whereas both remain WT in IFT144IR (F–F″) (n≥20 per genotype). Scale bar represents 25μm. (G–H) Quantification of fluorescence intensity ratio in the posterior compartment (PC) to the anterior compartment (AC) of Sens (G) and Dll (H) stained wing discs. The bars represent mean standard deviation (SD), n=4 representative stainings per genotype, **= p<0.01 and ***= p<0.001, NS = non significant; student t-test. (I–I′) Wt pattern of Sens (marker for canonical Wg signaling, in red) and Wg (marker for Notch signaling, in blue, monochrome in I′) in control wing disc expressing GFP under the control of enGal4. (J–N) Wg staining remains unaffected in all IFT-A KD (J′–N′) whereas Sens is lost in the posterior compartment of IFT122IR (J), IFT140IR (K), IFT121IR (L), IFT43IR (M) wing discs.
See also Figure S2.
