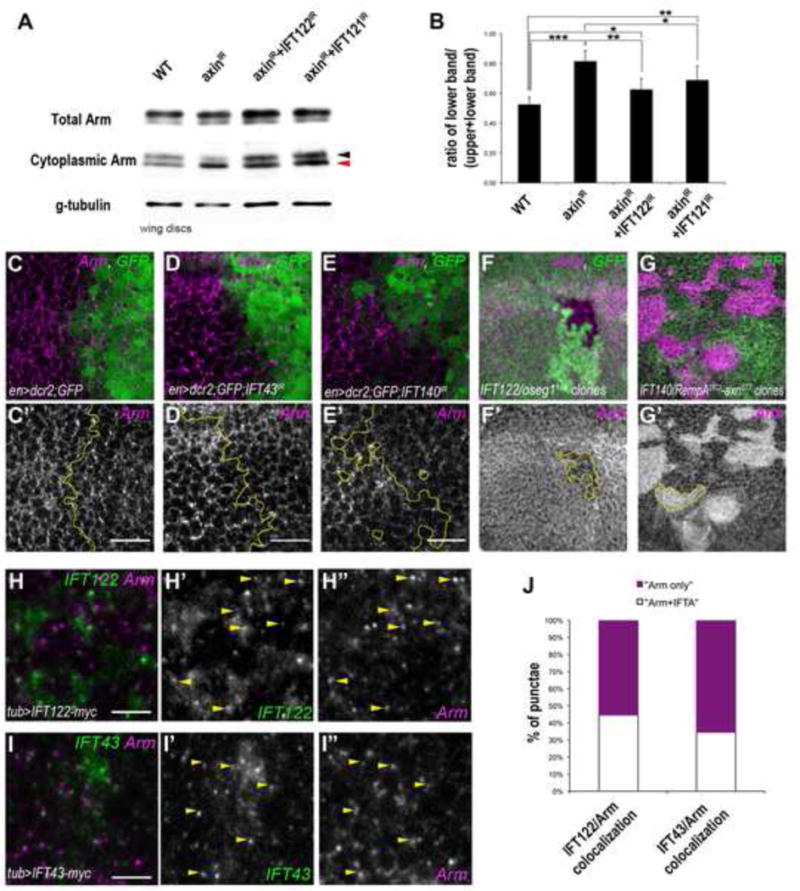
Figure 6. IFT-A proteins regulate Wg signaling by affecting the stability of excess Arm resulting from the destruction complex inhibition.

(A–B) Western blot analysis of cytoplasmic levels of Arm in wt, Axin-IR and Axin-IR combined with IFT122-IR or IFT121-IR wing disc extracts (black and red arrowheads indicate upper “inactive”/phosphorylated Arm band and lower “active”/stable Arm band, respectively (n=300 wing discs/genotype). (B) Quantification of 3 independent experiments of the ratio of lower band (“stable” Arm, red arrowhead) compared to the total cytoplasmic Arm levels. The bars represent mean SD, *= p<0.05, **= p<0.01 and ***= p<0.001; Student t-test.
(C–E) Cytoplasmic levels of Arm are reduced in cells of IFT43IR (magenta in D, monochrome in D′) and IFT140IR (magenta in E, monochrome in E′) compared to the wt control levels (magenta in C, monochrome in C′). See also the line scan quantification of protein staining in Suppl. Figure S6E–G. (F–F′) Cytoplasmic Arm levels are reduced in IFT122/oseg1179 clones (marked by GFP absence, below the junctional level; red F, monochrome in F′).
(G–G′) Cytoplasmic Arm levels are elevated in axnE77; IFT140/rempA21Ci double mutant clones (GFP negative cells; magenta in G, monochrome in G′) and indistinguishable from neighboring axnE77 single mutant clones (GFP positive cells with high levels of cytoplasmic Arm).
(H–J) IFT122 and IFT43 partially colocalize with Arm. tub-promoter driven IFT122-myc (green in H, monochrome in H′) and IFT43-myc (green in I, monochrome in I′) show partial co-localization (in punctate structures) with Arm (scan is just below the apical junctional region; see also apical staining of Arm and IFT in Suppl. Fig. S6H–I). (J) Quantification of the number of punctae containing Arm alone (magenta) or Arm with IFT122 or IFT43 (white; n≥200 punctae per genotype, from 4 different wing discs). See also line scan quantification of respective co-localization in Suppl. Fig. S6H″–I″. Scale bar represents 15μm in C–E and 3μm in H–I.
See also Figure S6.
