
Figure 1.
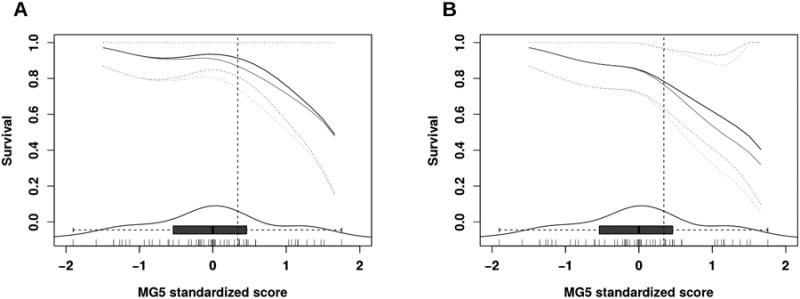
Probability of OS (A) and FFS (B) survival at 3 (black line) and 5 years (grey line), depending on MG5 score level. Dotted lines represent 95% CI. The box-and-whisker plot and density plot at the bottom of the graphs represent the distribution of the score levels. Each of the vertical segments at the bottom margin represents a patient. The vertical dotted line represents the MG5 top tertile.