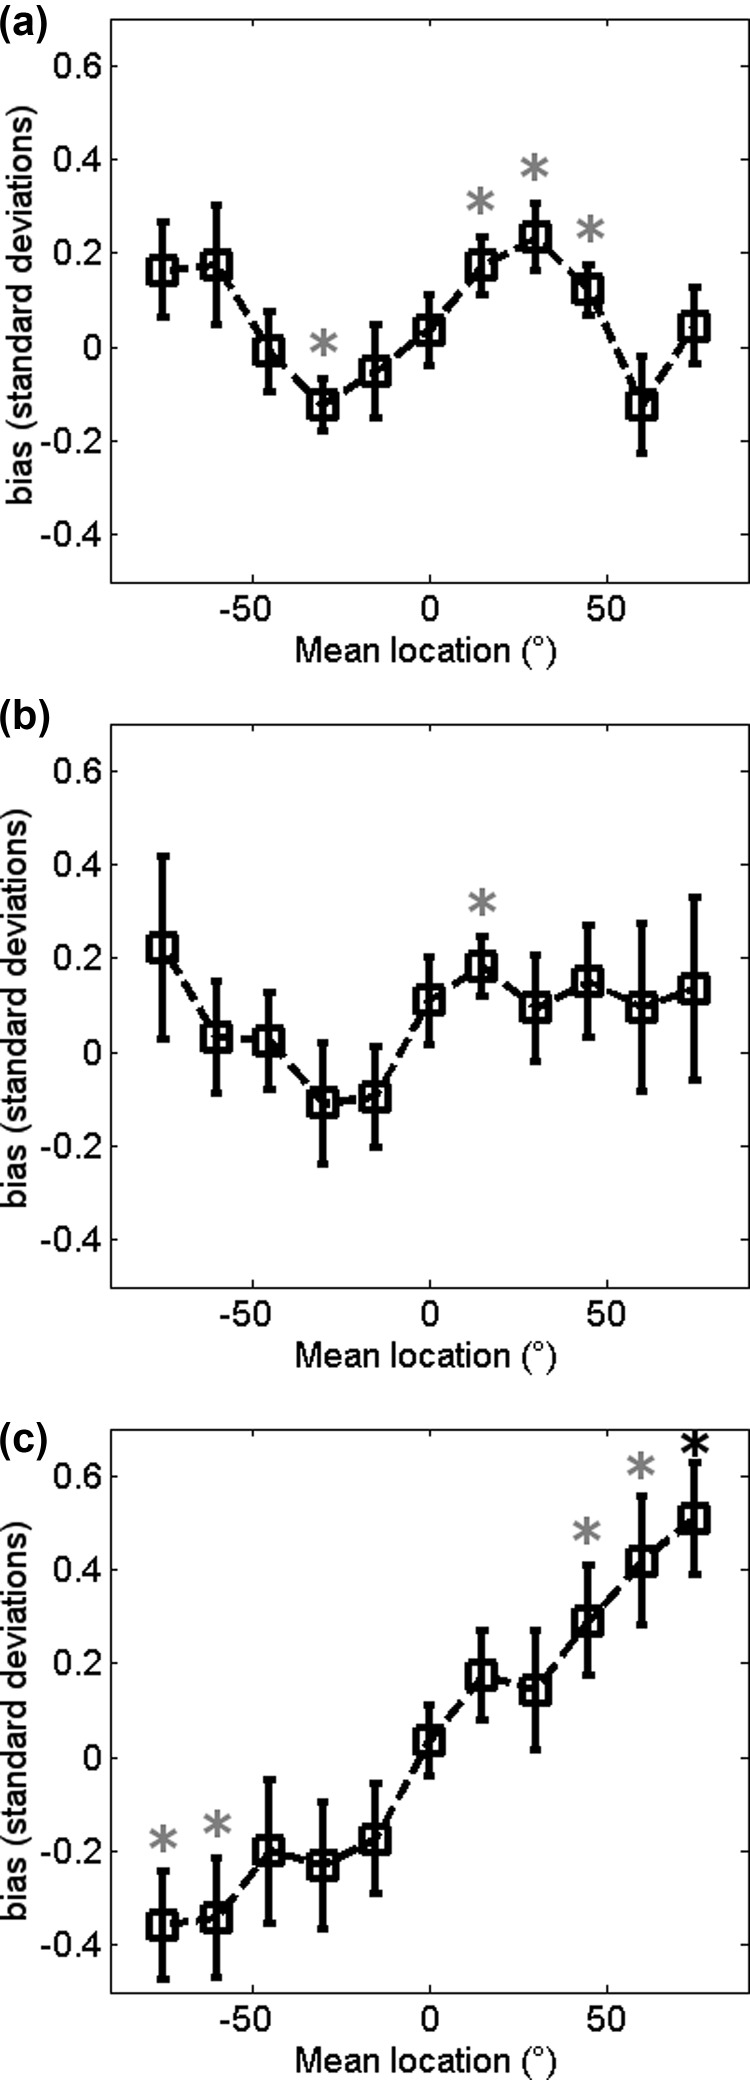
FIG. 3.
Bias at the mean stimulus location across conditions: Mean bias ± SEM of all participants at the mean locations of the stimuli in the BBN (a), LPN (b), and BPN (c) conditions. Gray asterisks indicate p < 0.05 in a t-test to check for difference from zero. The black asterisk in (c) indicates significance in the t-test after Bonferroni correction (p < 0.0045).

