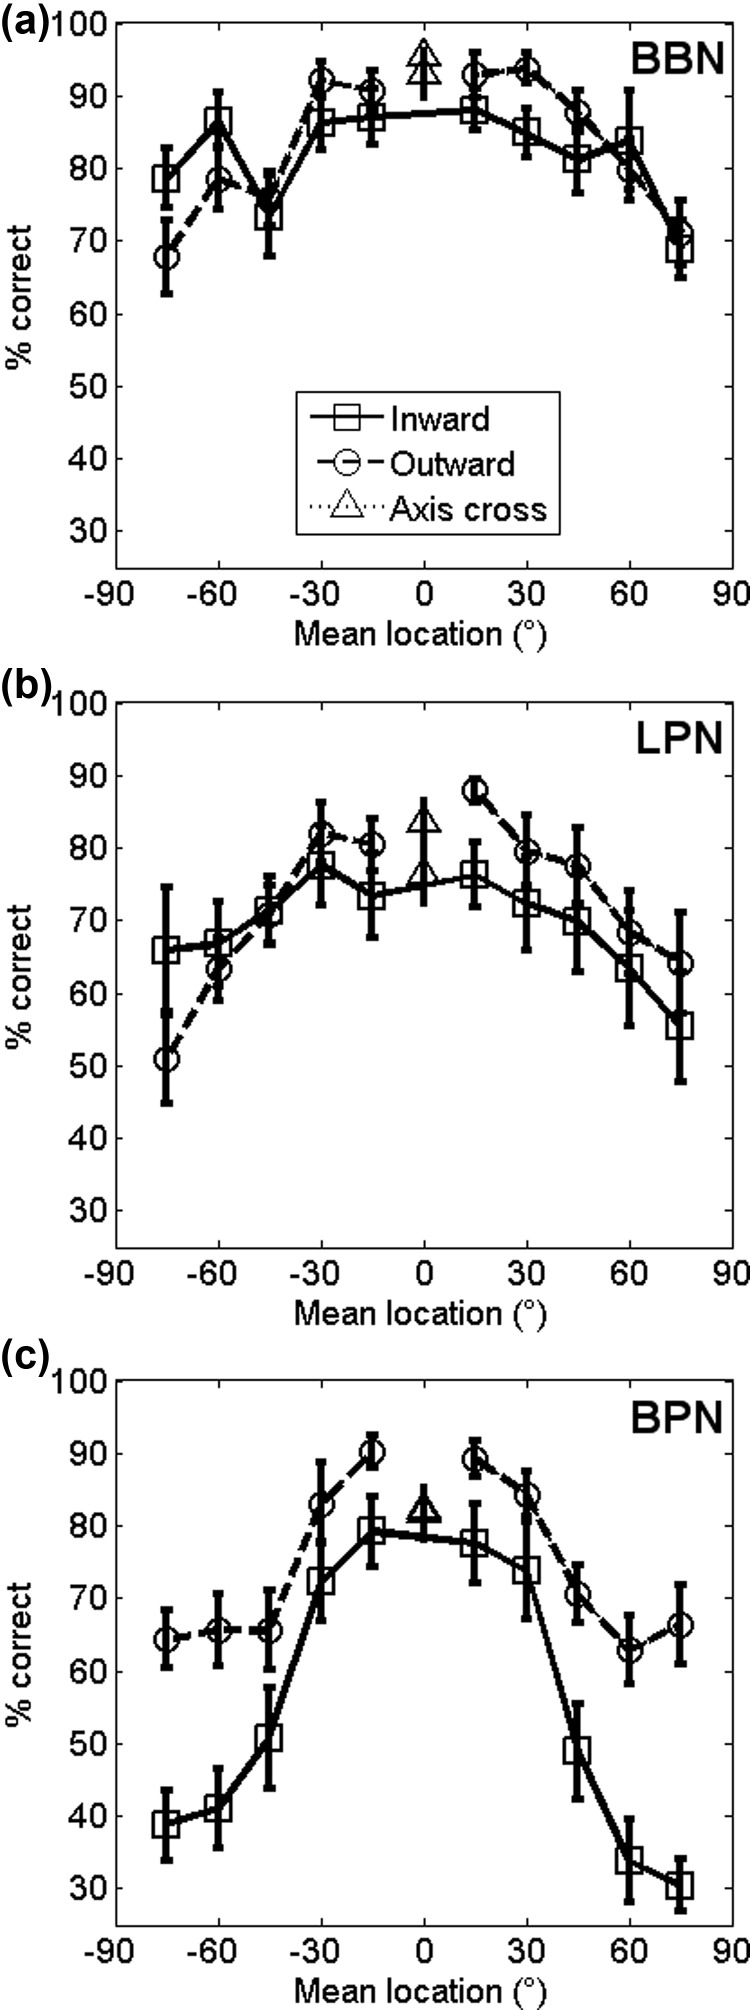
FIG. 4.
Effect of low and bandpass filters: (a) Mean percent correct of all participants separated into the direction of the target relative to the reference in the BBN condition. Circles/dashed lines show targets that moved away from the midline (0°) relative to the reference location, squares/solid lines show sounds that moved toward the midline relative to the reference and triangles show targets that crossed the midline. (b) Mean percent correct for all participants in the LPN condition. (c) Mean percent correct for all participants in the BPN condition.

