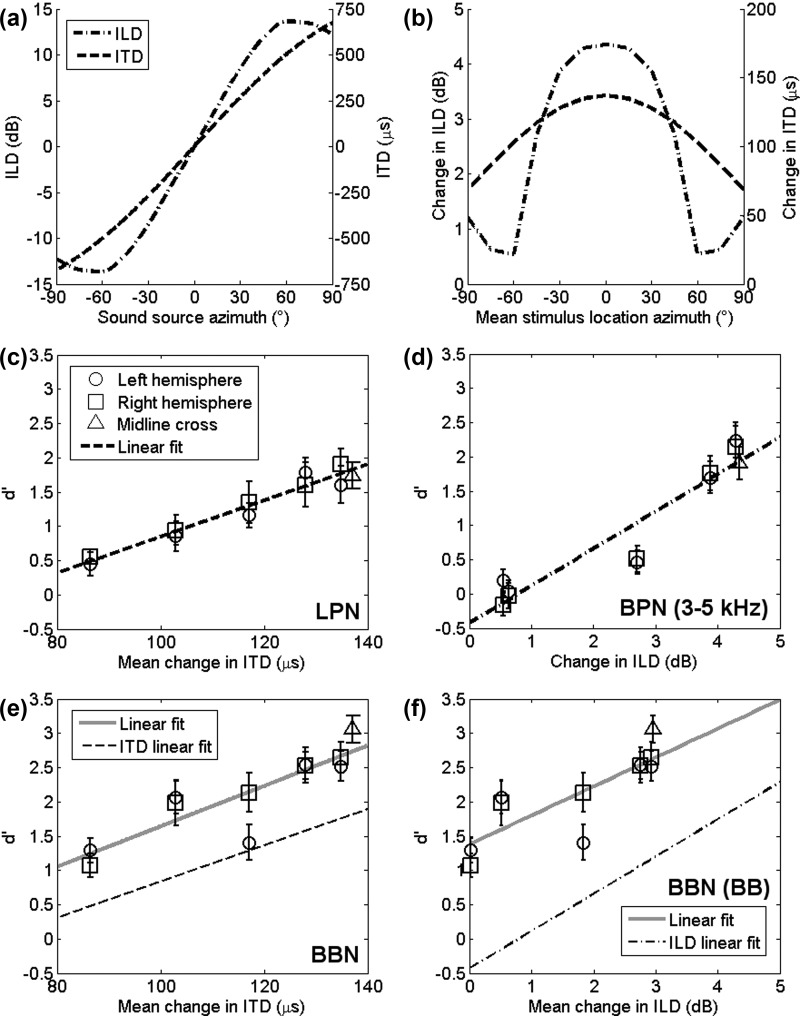
FIG. 5.
Real world changes in the binaural cues: (a) Changes in ITD and ILD cues as sound source azimuth varies. Dashed line shows changing ITD cues. Dashed-dotted lines show changing ILD cues [ILD values calculated using data from Shaw and Vaillancourt (1985)]. (b) Shows the change in ILD and ITD cues at the mean stimulus locations. (c) Shows the mean d′ values from the LPN condition plotted as a function of the change in ITD a stimulus elicited. The dashed line shows a linear fit of the data. (d) Shows the mean d′ values from the BPN condition plotted as a function of the change in ILD (frequency weighted to reflect the bandpass filter of 3–5 kHz) a stimulus elicited. The dashed-dotted line shows a linear fit of the data. (e) Shows the mean d′ values from the BBN condition plotted as a function of the change in ITD a stimulus elicited. The gray solid line shows a linear fit of this data. The dashed line shows the linear fit of the LPN data from (b). (f) Shows the mean d′ values from the BBN condition plotted as a function of the change in ILD (frequency weighted to reflect the broadband stimulus presented at 48 kHz) a stimulus elicited. The gray solid line shows a linear fit of this data. The dashed-dotted line shows the linear fit of the BPN data from (c).

