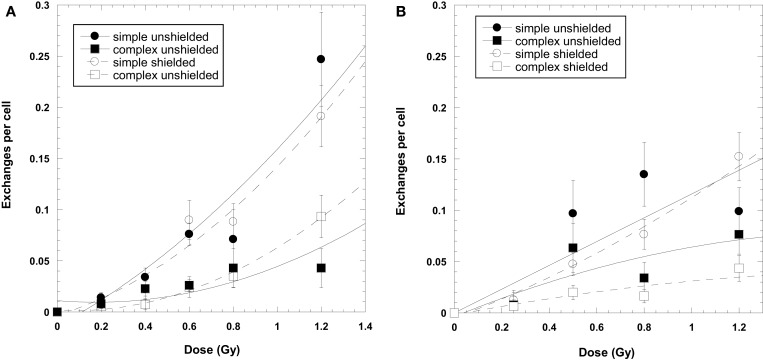
Figure 2.
Dose–response curves for chromosome exchanges induced by 2500 MeV protons (A) and 2000 MeV/μ protons (B). The 2000-MeV exposures were shielded with a combination of 50 g/cm2 aluminum and 10 cm polyethylene. The 2500-MeV exposure were shielded with 50 g/cm2 aluminum only. Error bars indicate SEMs and background values have been subtracted for all data points. Curve fit is extrapolated to the axis.

