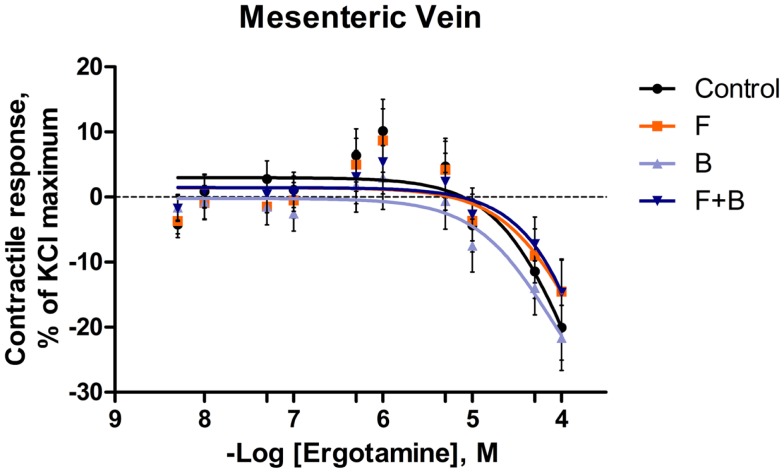
Figure 3.
Mean contractile response, as % KCl maximum of mesenteric vein to increasing concentrations of ergotamine for pretreatments without tall fescue seed extract: only Krebs–Henseleit buffer (control); 1 × 10⁻⁶ M formononetin (F); or 1 × 10⁻⁶ M biochanin A (B); and combination of 1 × 10⁻⁶ M F and 1 × 10⁻⁶ M B (F + B). The regression lines were plotted for each treatment using a non-linear regression with fixed slope, and the sigmoidal concentration response curves were calculated by the following equation: where top and bottom are the plateaus of contractile response as percentage of 120 mM KCl maximum response. EC50 is the molar concentration of ergotamine inducing 50% of the KCl maximum response.

