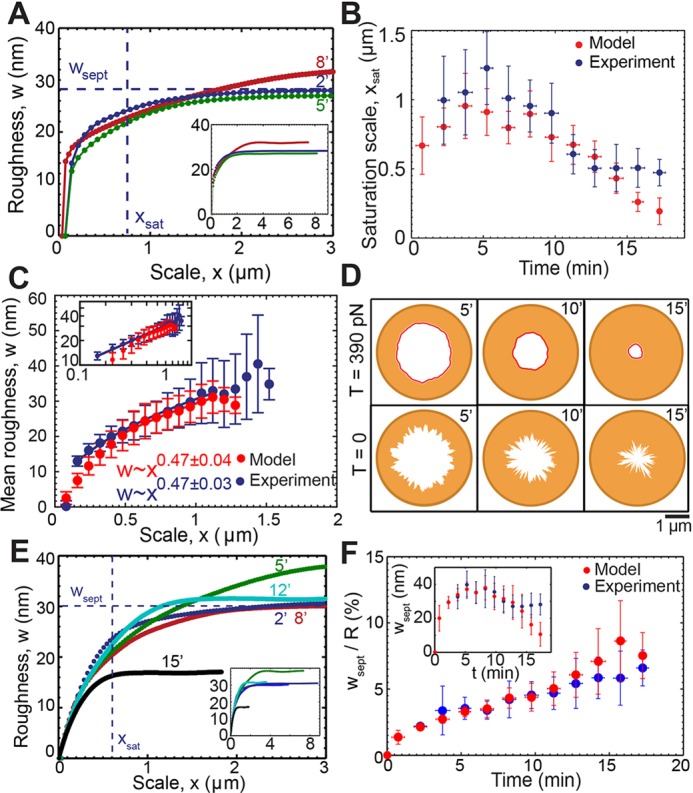
Fig. 2.

Roughness of septum edges is length scale dependent and follows a power law reproduced by a model of septum growth regulated by ring tension. Supplementary material Table S1 lists the model parameters. (A) Roughness w versus length scale x for the septum edges of Fig. 1B at the indicated times. Dashed lines indicate wsept and xsat at time point 2 min. Inset shows full roughness profiles. (B) Roughness saturation length xsat versus time for experimental constrictions of Fig. 1F (blue) and simulated constrictions (red); simulation: n=428 edges from 30 constrictions). Points are mean±s.d. Bin width, 1.5 min. (C) Mean roughness w versus length scale x for the experimental and simulated constrictions shown in B. For each x, the mean is over all constrictions, for which x<xsat and over all times. The exponent of the best-fit power law to simulated data is 0.47±0.04 (95% confidence interval) for 0.48 μm≤x≤1.12 μm . Error bars denote s.d. Inset shows plot of log mean roughness versus log length scale x. (D) Typical simulated septum edges at indicated times (min) after the onset of constriction at two tensions. (Top row) T=390 pN as measured in protoplasts. (Bottom row) T=0. (E) Roughness w versus scale x for simulated constrictions as shown in D, at T=390 pN. Dashed lines indicate maximum roughness wsept and roughness saturation scale xsat after 2 min. Inset shows complete roughness profiles for the same edges. (F) Ratio of septum roughness to mean septum radius versus time for simulated and experimental constrictions and times of B. Inset shows septum roughness versus time for same data. Bin width, 1.5 min. Points are mean±s.d.
