Fig. 2.
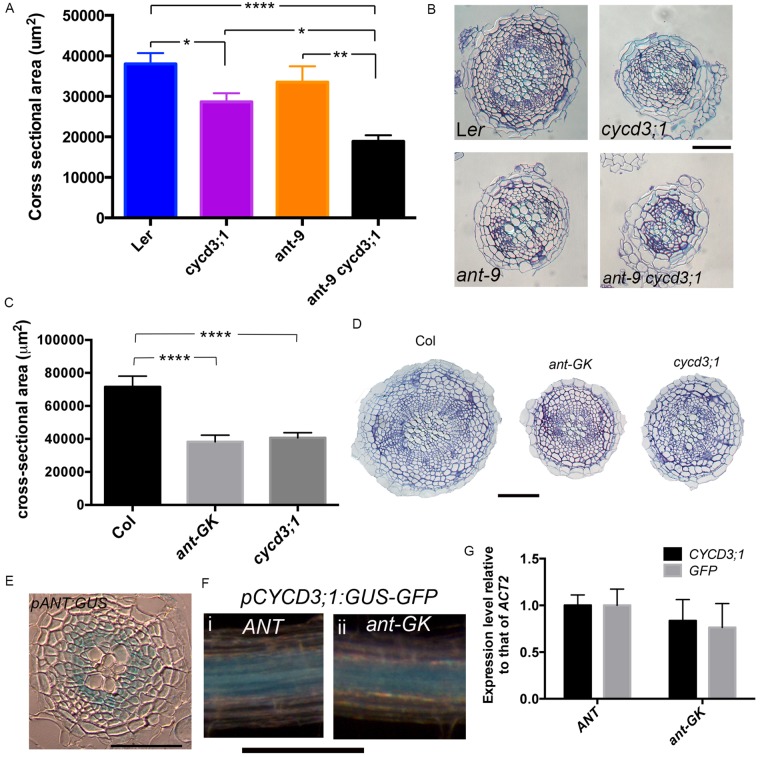
Interaction between ANT and CYCD3;1 in root secondary growth. (A,C) Stele cross-sectional area in 30 DAG Ler, cycd3;1, ant-9 and ant-9 cycd3;1 roots (A) and 21 DAG Col-0, ant-GK and cycd3;1 (Col-0) roots (C). *0.01<P<0.05, **0.001<P<0.01, ****P<0.0001; Error bars represent s.e.m. (B,D) Transverse sections of roots in A (B) and C (D). Scale bars: 100 µm. (E) Transverse section from a GUS-stained 14 DAG pANT:GUS root. Scale bar: 50 μm. (F) pCYCD3;1:GUS-GFP expression in 14 DAG ANT (i) and ant-GK (ii) roots. Scale bar: 200 µm. (G) qPCR analysis of CYCD3;1 and GFP in 16 day-old ANT pCYCD3;1:GUS-GFP and ant-GK pCYCD3;1:GUS-GFP roots. Error bars: s.d. in four biological replicates, each from eight pooled roots.

