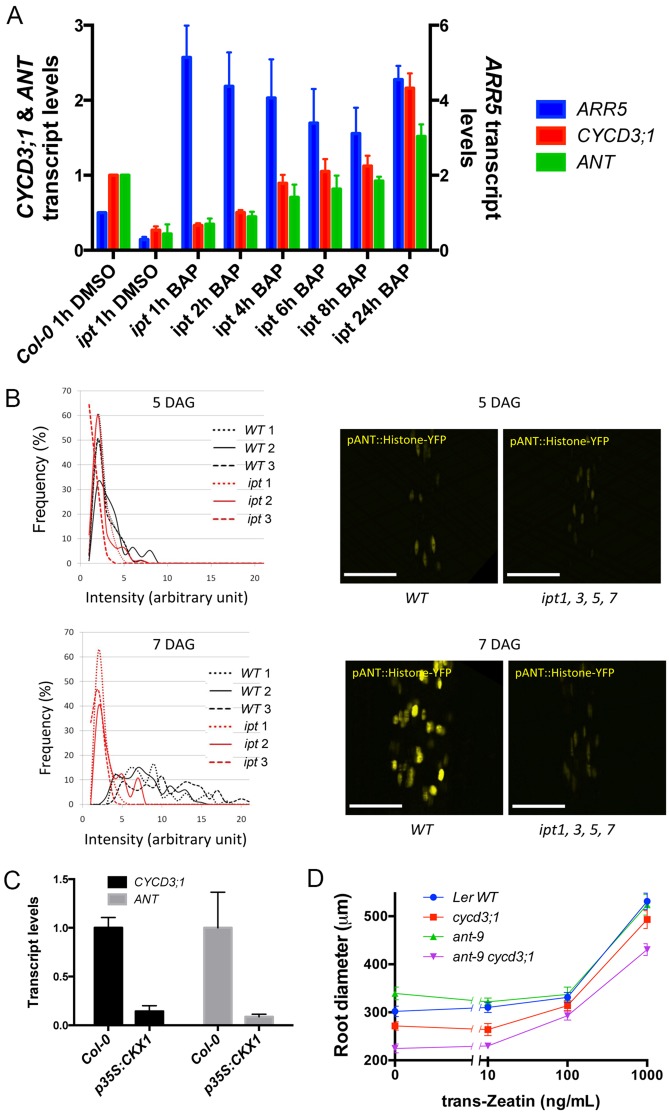
Fig. 3.
ANT and CYCD3;1 respond to cytokinins in root secondary thickening. (A) qPCR analysis of ARR5, ANT and CYCD3;1 in Col-0 and ipt1;3;5;7 roots treated with DMSO and ipt1;3;5;7 roots treated with 1 µM BAP for the periods indicated. Error bars represent s.d. from 3 biological replicates. (B) Intensity of YFP signal in lines expressing pANT:H2B-YFP at 5 DAG and 7 DAG in WT plants vs ipt1,3,5,7 plants. WT1-3 and ipt1-3 each represent three independent T3 lines homozygous for pANT:H2B-YFP. ipt1-3 are also homozygous for ipt1;3;5;7 alleles. In each line, signal intensity was measured from >50 nuclei. Frequency distributions of signal intensity are shown. (C) Transcript levels of CYCD3;1 and ANT in Col-0 and p35S:CKX1 roots. s.d. in three biological replicates is shown. (D) Diameter of Ler, cycd3;1, ant-9 and ant-9 cycd3;1 roots following tZ treatments. Roots were grown for 11 days then transferred to media containing (or not for control) tZ. Error bars represent s.e.m.

