Fig. 3.

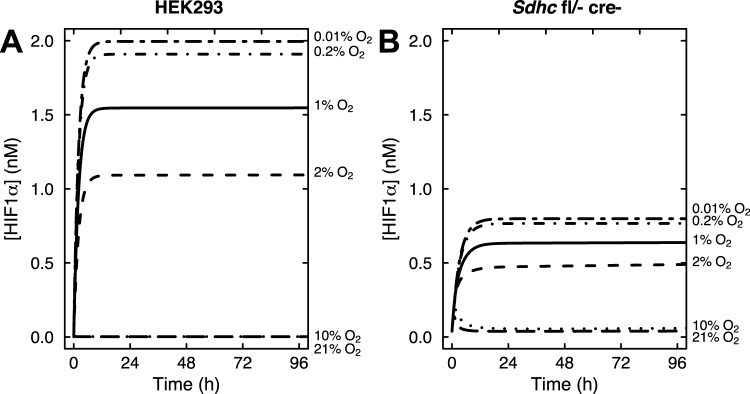
Mathematical model results showing the time course of HIF1α accumulation at oxygen levels ranging from 0.01% to 21% oxygen, as indicated. (A) Control SDHB knockdown HEK293 cells. (B) Control Sdhc knockout fibroblasts.

Mathematical model results showing the time course of HIF1α accumulation at oxygen levels ranging from 0.01% to 21% oxygen, as indicated. (A) Control SDHB knockdown HEK293 cells. (B) Control Sdhc knockout fibroblasts.