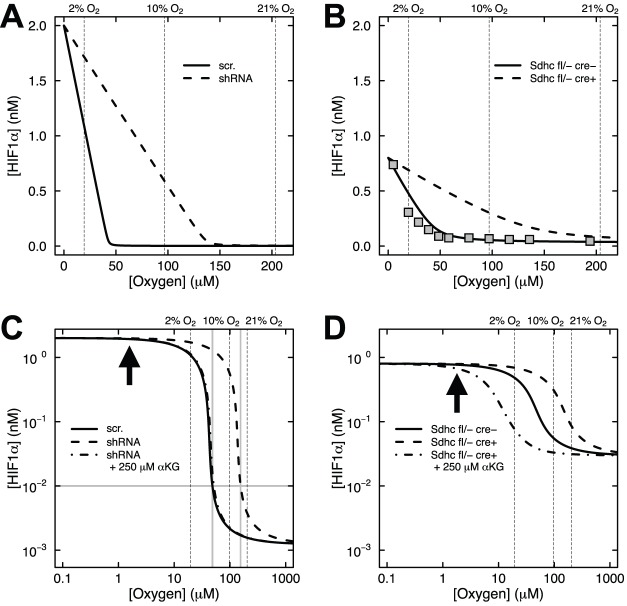
Fig. 4.
Model predictions of the effects of succinate accumulation and hypoxia on HIF1α concentration under endogenous αKG conditions or αKG rescue. (A) SDHB knockdown HEK293 cells transduced with scrambled (scr.) shRNA control or SDHB knockdown shRNA (shRNA) driving succinate accumulation (solid and dashed lines, respectively). (B) Sdhc knockout fibroblasts with control genotype (Sdhc fl/− cre−) or genotype driving succinate accumulation (Sdhc fl/− cre+). Data from HeLa cells (filled squares) are shown for comparison (Jiang et al., 1996). (C,D) Log-log plots of A and B showing the effects of succinate accumulation and hypoxia on HIF1α concentration under endogenous αKG conditions or with 250 μM αKG treatment (dot-dash lines). Bold arrows indicated 0.2% oxygen. Gray lines in C show that 0.01 nM HIF1α corresponds to 5% oxygen in control cells, but 16% oxygen in SDHB knockdown cells.

