Fig. 1.
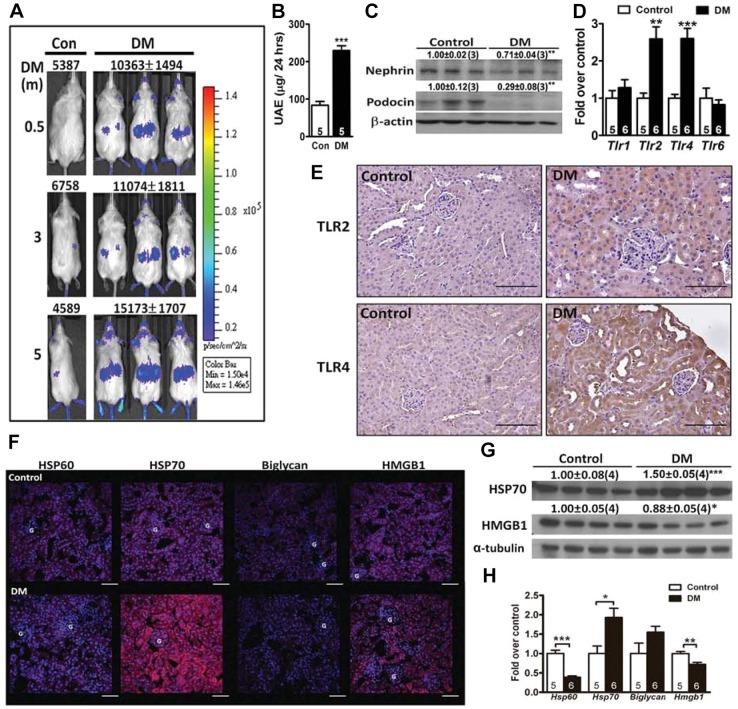
Expression and localization of inflammatory mediators in the diabetic kidney. (A) Imaging and photon counting in diabetic and control male transgenic (NF-κB-RE-luciferase) mice that were diabetic for 0.5, 3 or 5 months. The color overlays on the images represent the photons per second emitted, and the quantified photon signals are shown. Daily urinary albumin excretion (UAE; B) and immunoblot analyses (C) on nephrin and podocin from the kidney of 1-month-diabetic C57BL/6 mice. The relative intensities of the bands are indicated by densitometric quantification compared with control mice, with the number of mice in parentheses. (D) Expression of TLRs in the kidney of 1-month-diabetic relative to control mice. Immunohistochemical staining for TLR2 and TLR4 (E) and immunofluorescence staining for HSP60, HSP70, biglycan and HMGB1 (red) (F) in the kidney of 1-month-diabetic and control mice. The DAPI nuclear counterstain appears blue. Scale bars: 50 µm. G, glomerulus. (G) Immunoblot analyses on HSP70 and HMGB1 from the kidney of 1-month-diabetic C57BL/6 mice. (H) Expression of DAMPs in the kidney of 1-month-diabetic relative to control mice. *P<0.05, **P<0.01 and ***P<0.001.

