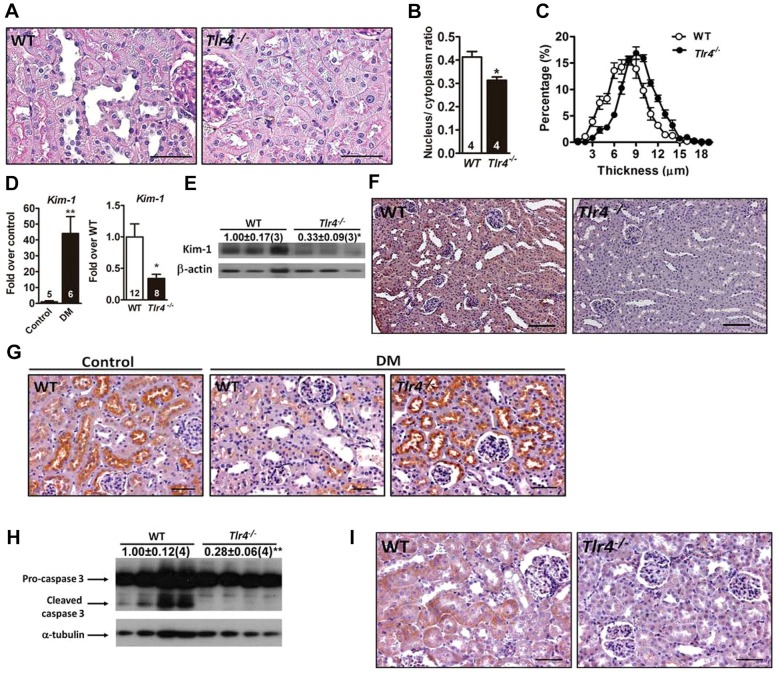
Fig. 2.
Renal tubular injury and apoptosis in Tlr4−/− diabetic mice. Representative tubular morphology (A), quantification of the tubular nucleus-to-cytoplasm ratio (B) and distribution of tubular epithelial thickness (C) in Tlr4−/− and WT 1-month-diabetic mice. Scale bars: 50 µm. (D) Expression of Kim-1 in WT control mice and WT and Tlr4−/− 1-month-diabetic mice. Numbers inside the bars indicate the number of mice in each group. Immunoblot analyses (E) and immunohistochemical staining (F) of Kim-1 in the kidney of Tlr4−/− and WT 1-month-diabetic mice. Scale bars: 100 µm. (G) Immunohistochemical staining of cubilin in the kidney of WT control mice and WT and Tlr4−/− 1-month-diabetic mice. Scale bars: 50 µm. Immunoblot analyses (H) and immunohistochemical staining (I) of caspase 3 in the kidney of 1-month-diabetic mice. The relative intensities of the bands are indicated by densitometric quantification with WT, with the number of mice in parentheses. Scale bars: 50 µm. *P<0.05 and **P<0.01.

