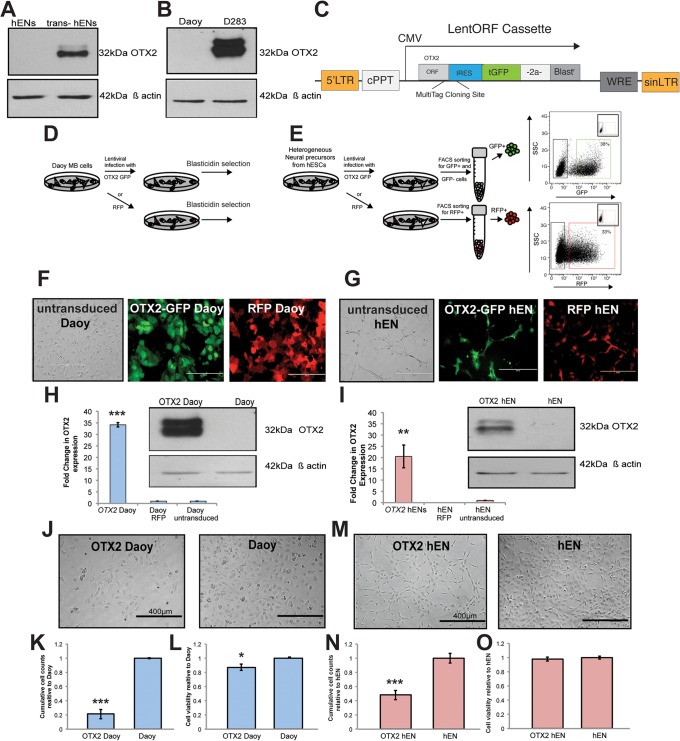
Fig. 1.
Overexpression of OTX2 in Daoy and hEN cells decreases cell growth. (A,B) Endogenous protein levels of OTX2 in hEN versus trans-hEN cultured in neural precursor conditions for 7 days (A) and Daoy (SHH MB variant) versus D283 (Group 4 MB variant; B). β-actin serves as a loading control. (C) LentiORF cassette used for stable overexpression of OTX2 in hEN and Daoy cells. (D,E) Schematic representation of stable Blasticidin selection for OTX2-Daoy and RFP-Daoy cells (D) and sorting procedure used to distinguish between infected (GFP+) and non-infected (GFP−) hEN cells as well as RFP+ control hENs (E). (F,G) Blasticidin-selected Daoy populations (F) and sorted hEN cell populations (G) used for cell proliferation, self-renewal and migration assays in vitro. Scale bars: 200 µm. (H,I) Validation of stable OTX2 overexpression in Daoy (H) and hEN (I) by qPCR and western blot. β-actin serves as a loading control. Error bars: s.e.m. **P<0.01, ***P<0.001. (J-O) Overexpression of OTX2 reduces cell number in both Daoy (J-L) and hEN cells (M-O). In both cell lines, OTX2 overexpression significantly decreases total cell number (J,K,M,N), with only a small change in cell viability (L,O). Scale bars: 400 µm. Error bars: s.e.m. *P<0.05, ***P<0.001. For all experiments, n=3 biological replicates or independent infections.

