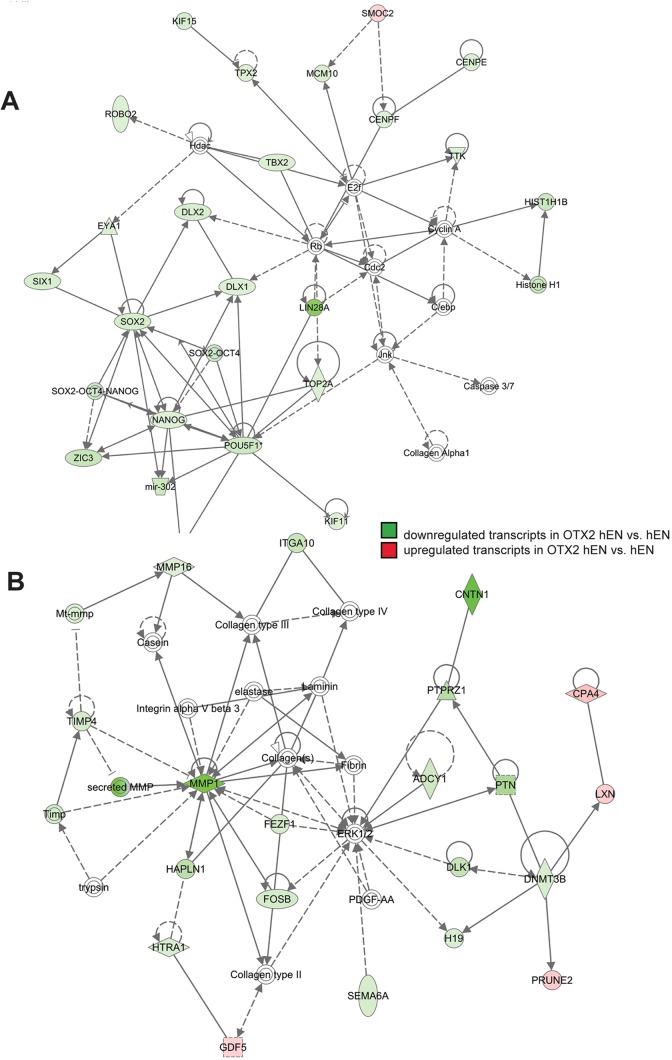
Fig. 3.
OTX2 overexpression results in dysregulation of transcriptome networks associated with cell proliferation and cell motility. Top dysregulated cellular networks consisting of transcripts associated with cell proliferation (A) and cell migration (B). Shaded green areas denote transcripts that are significantly downregulated and red areas denote significantly upregulated transcripts in OTX2 hENs versus hENs. Note that the vast majority of transcripts are downregulated in OTX2 hENs. n=3 biological replicates or independent infections.

