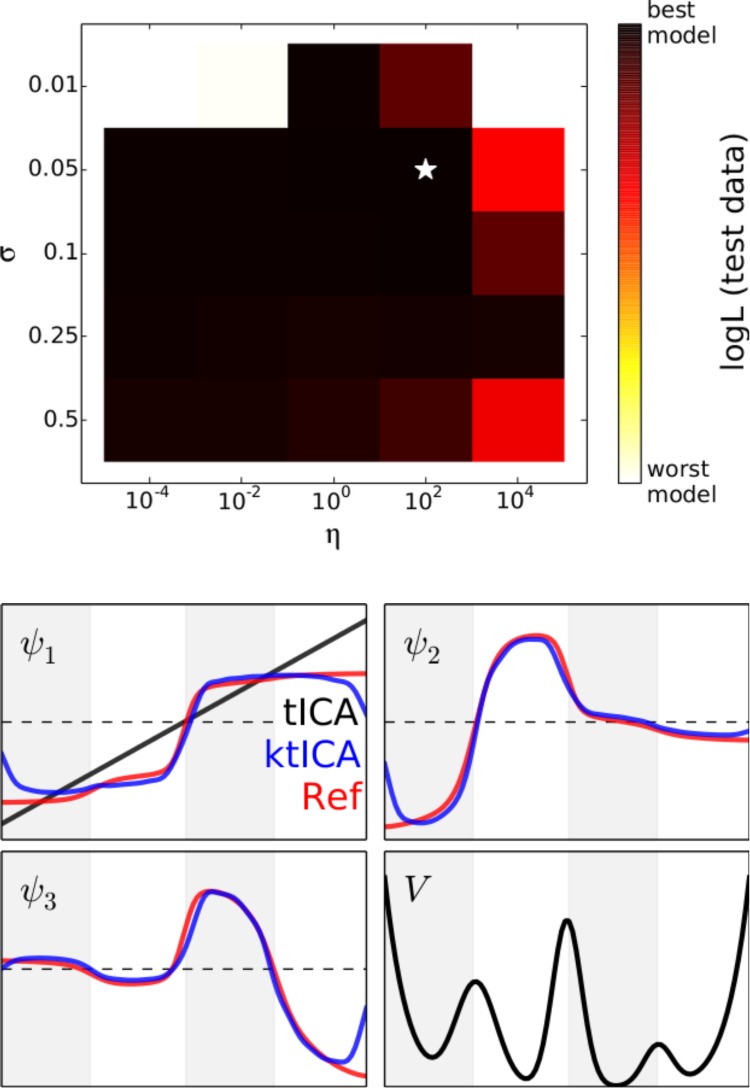
Figure 1.

Approximate log likelihood evaluated on test data provided a similar score for most models we tested. Models using a value of 0.01 for σ or a value of 104 for η were given very low scores, while all other models seemed to be good enough. The best model according to the likelihood evaluated on test data correctly determined the top three eigenfunctions for this system. The ktICs are shown in blue while the actual eigenfunctions are shown in red. It is illustrative to remember that the tICA solution is trivial in this one-dimensional case. Even in this simple case, the nonlinearity in the ktICs prove to be essential for estimating the transfer operator’s eigenfunctions.
