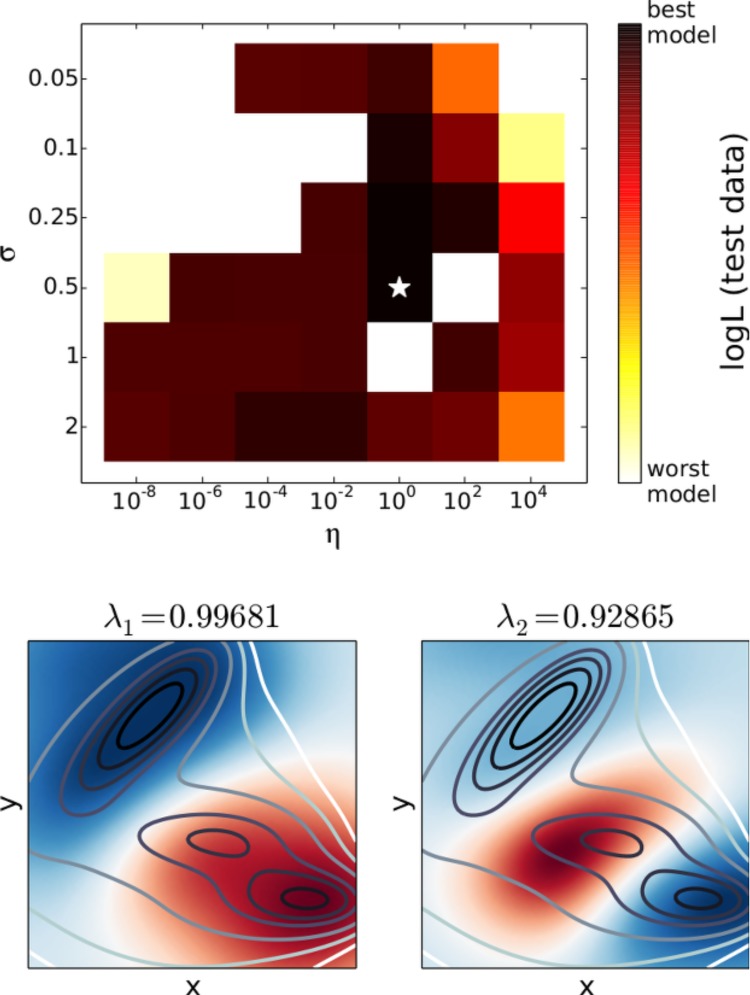
Figure 2.

ktICA models for the Müller potential simulations are not as well-behaved as the one-dimensional case. There were a few models that assigned a nonpositive value for the likelihood of test data (white regions above). However, the maximum likelihood model correctly identified the top two eigenfunctions, which separate the three major minima in the potential energy surface. These eigenfunctions are depicted in the bottom two panels, with the red and blue color corresponding to the value of the ktIC. The contour lines denote the potential energy of the system.
