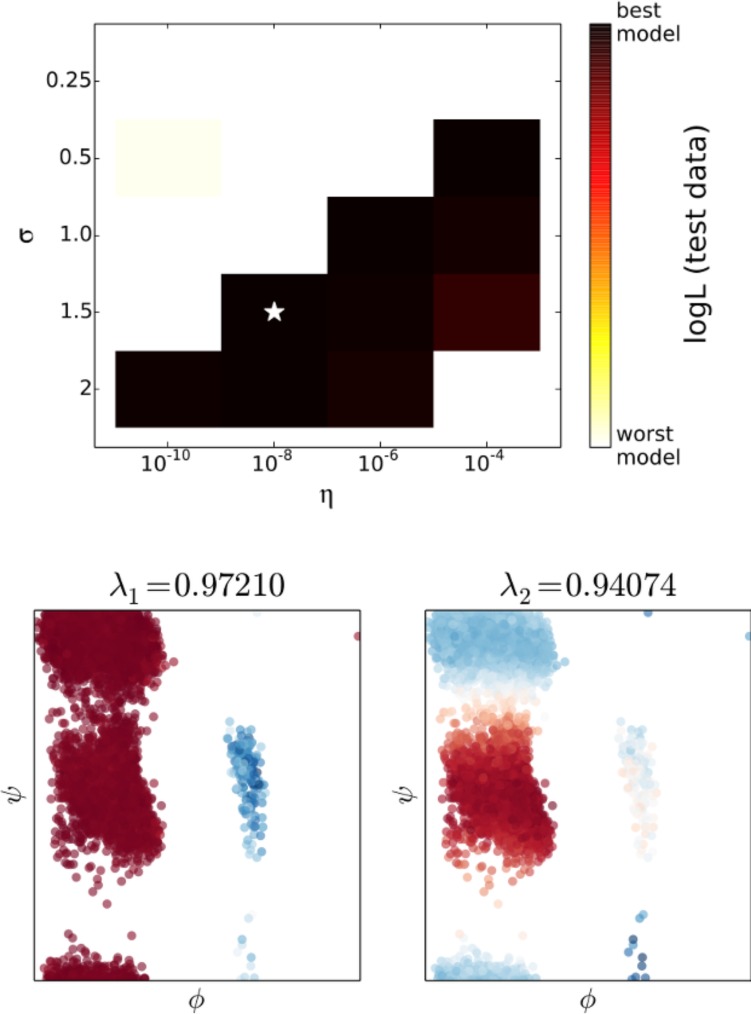
Figure 4.

As in the one-dimensional case, there are several models that are very good according to the cross-validation scores, while models with small values of σ and η perform poorly. Alanine dipeptide has been studied extensively, and it is known that the slowest two relaxations occur along the axes of the Ramachandran plot. The projection of the test data set into these axes shows that the top two ktICs correctly identify the slow motions in the alanine dipeptide simulations.
