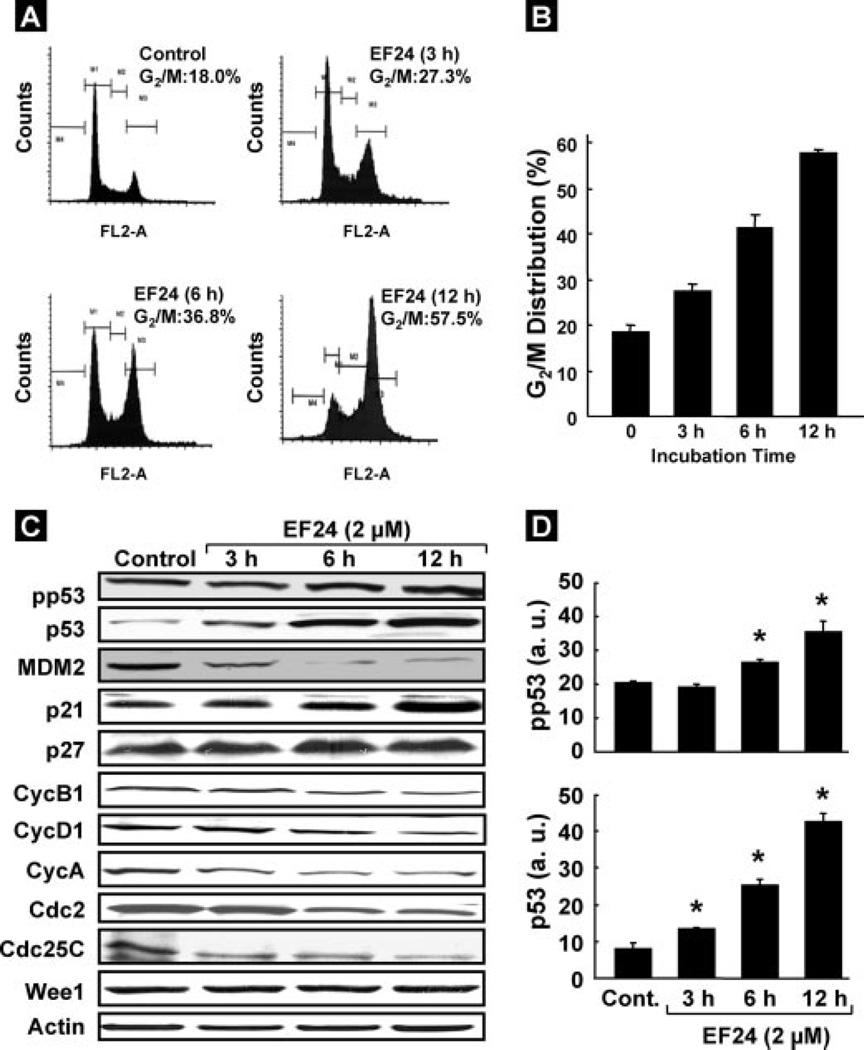
FIGURE 2. Effect of EF24 on cell cycle progression and cell cycle regulatory molecules in CR cells.
Cells were cultured in complete medium, and treated with either Me2SO vehicle control or 2 µmEF24. After 3, 6, or 12 h of treatment, cells were collected, washed with PBS, digested with RNase, and then the cellular DNA was stained with propidium iodide. Flow cytometric analysis was then performed for cell cycle distribution. A, representative flow cytometry graph for each treatment group. B, G2/M cell cycle distribution as a function of treatment period. C, immunoblot images of cell cycle regulatory molecules pp53, p53, MDM2, p21, p27, CycB1, CycD1, CycA, Cdc2, Cdc25C, and Wee1in CR cells treated with 2 µm EF24. D, quantitative results of phosphorylated p53 and p53 bands by densitometric analysis. Data represent mean ± S.E. of three independent experiments. *, p < 0.05 as compared with control group.

