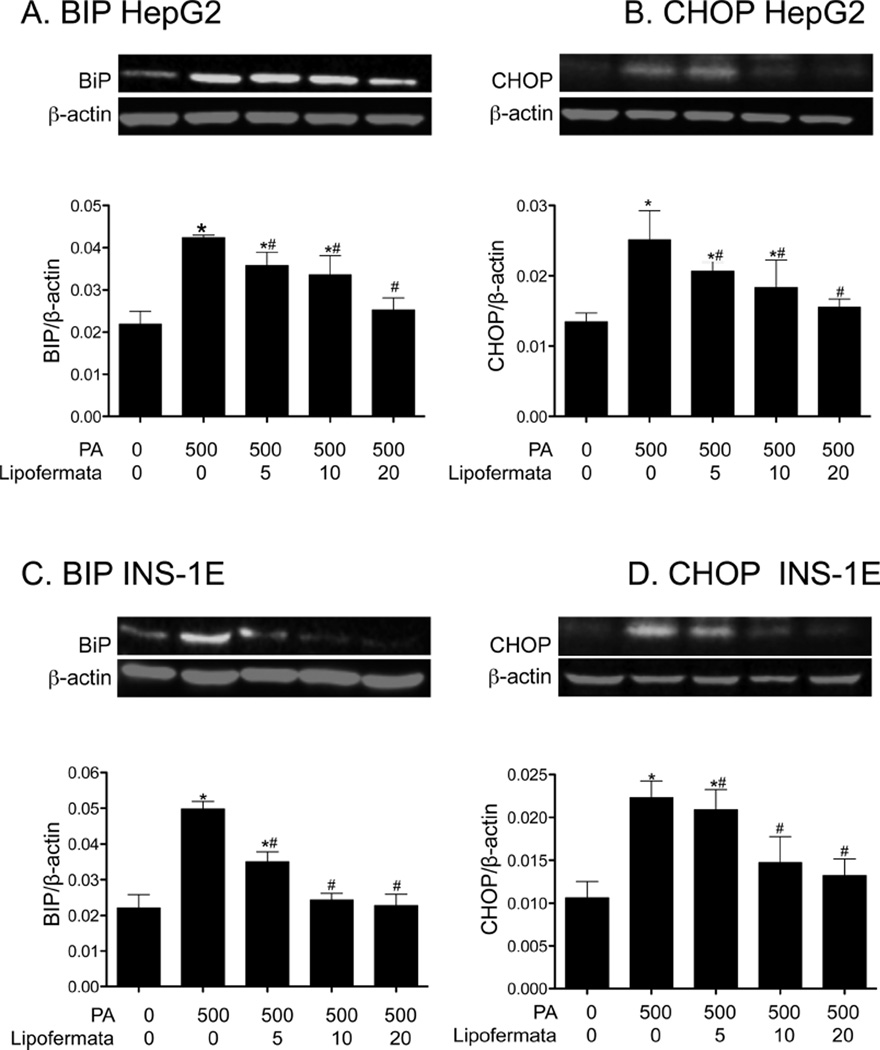
Fig. 10.
Lipofermata prevents the induction of cell stress response proteins BiP and CHOP by PA treatment in HepG2 and INS-1E cells. The ER chaperone BiP and the transcription factor CHOP were quantified by western blotting. The colored figures are representative western blots. Bar height indicates the mean ± SEM for BiP or CHOP as indicated in each of the cell lines from 3 independent experiments. The expression levels were normalized to that of β-actin (red bands). *p < 0.05 for comparison to controls without palmitate or Lipofermata; #p < 0.05 for compound and palmitate treated cells compared with cells treated with 500 µM palmitate alone.

