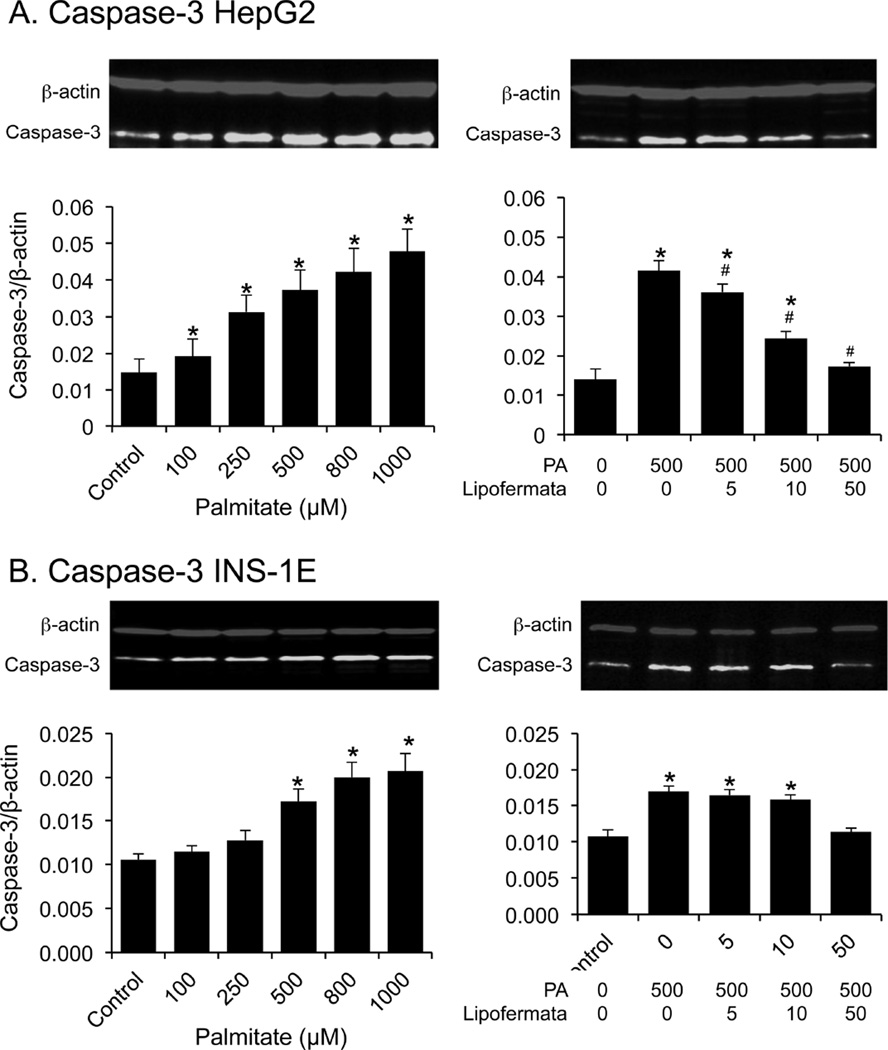
Fig. 11.
Lipofermata prevents induction of caspase-3 protein expression in HepG2 or INS-1E cells treated with palmitate. Cells were exposed to increasing concentrations of (A) palmitate, or (B) to a combination of palmitate and Lipofermata, as indicated. After 24 h of incubation, caspase-3 abundance was evaluated by Western blotting. The upper images are representative western blots. In the lower bar graphs, bar height indicates the mean ± SEM for caspase-3 of 3 experiments. The expression level of the caspase-3 (green bands) was normalized to that of β-actin (red bands). *p < 0.05 for comparison to controls without palmitate or Lipofermata; #p < 0.05 for compound and palmitate treated cells compared with cells treated with 500 µM palmitate alone.

