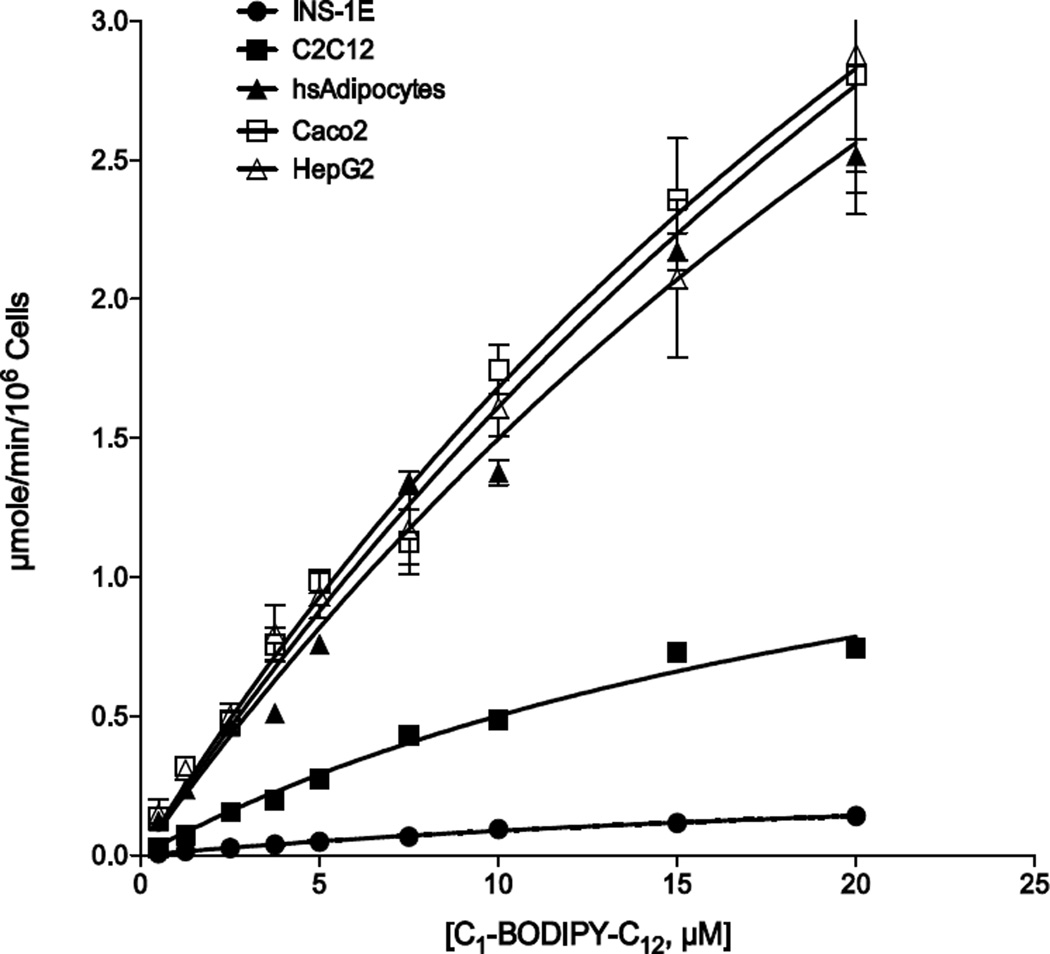
Fig. 2.
Kinetics of C1-BODIPY-C12 uptake in targeted cell lines. Fatty acid transport was measured in real-time using C1-BODIPY-C12 at 5 sec intervals for 5 min. The linear rate of uptake for each concentration of fluorescent fatty acid was determined using initial values from 30 to 90 sec and plotted as µmole/min/106 cells as indicated. The error bars represent the standard error of the mean from three independent experiments.

