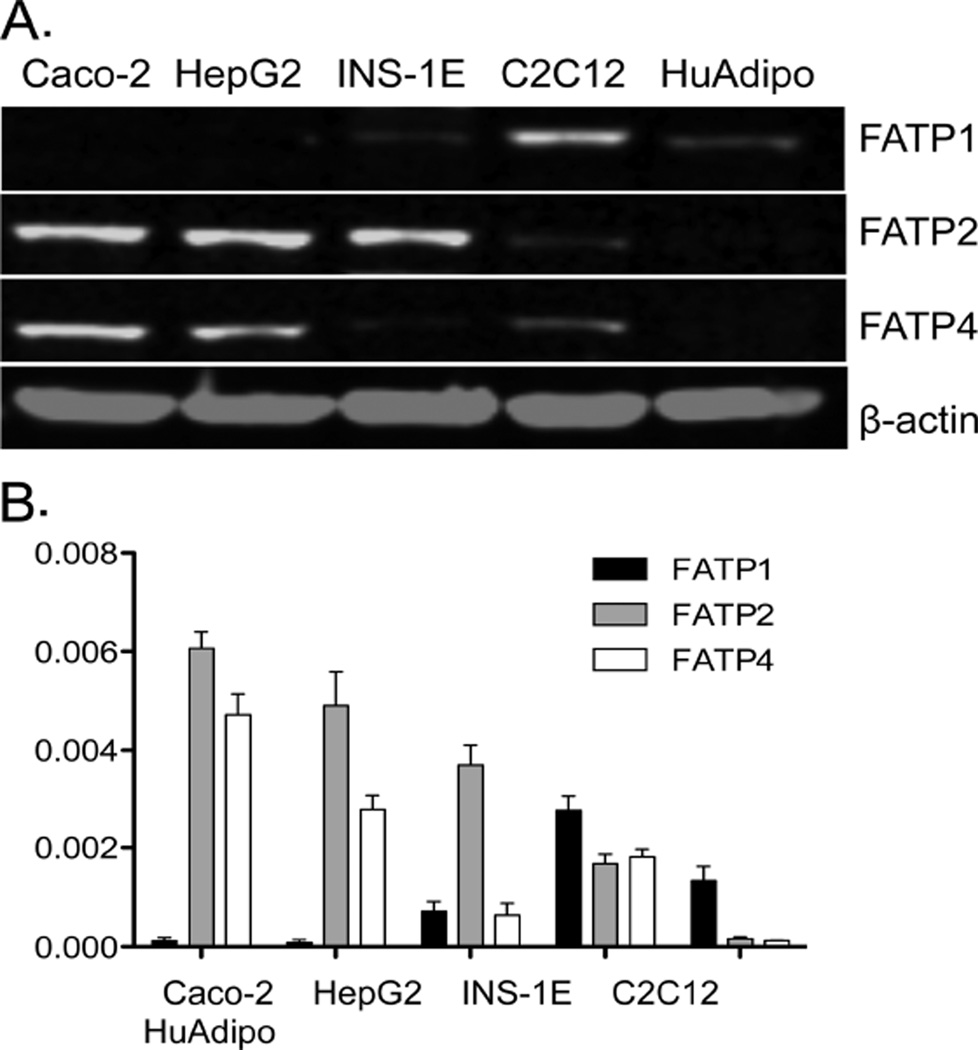
Fig. 3.
Expression of FATP proteins in various cell lines. Western blots employing antibodies against FATP1, 2 or 4 were used to measure the expression of each protein in the targeted cell lines as shown. (A) Representative western blots comparing expression of the relevant FATP compared with ß-actin used as a loading control. (B) Results were quantified using Odyssey imaging software (Li-COR, Lincoln, NE, USA). The bar height indicates the mean of three experiments assayed in triplicate. Error bars indicate standard deviation from the experimental mean.

