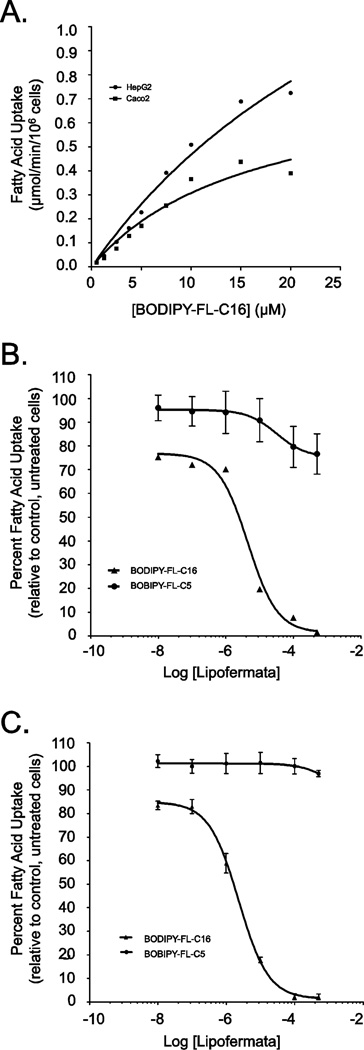
Fig. 6.
Kinetics of BODIPY-FL-C5 and -C16 uptake in HepG2 and Caco-2 cells and inhibition by Lipofermata. (A) Fatty acid transport rates were measured in real-time using BODIPY-FL C16 at 5 sec intervals for 5 min in HepG2 and Caco-2 cells as indicated. The linear rate of uptake was determined using initial values from 30 to 90 sec at each ligand concentration. The error bars represent the standard error of the mean from three independent experiments. Inhibition of BODIPY-FL C16 but not BODIPY- FL C5 uptake by Lipofermata occurred in a dose responsive manner in (B) HepG2 and (C) Caco-2 cells, respectively.

