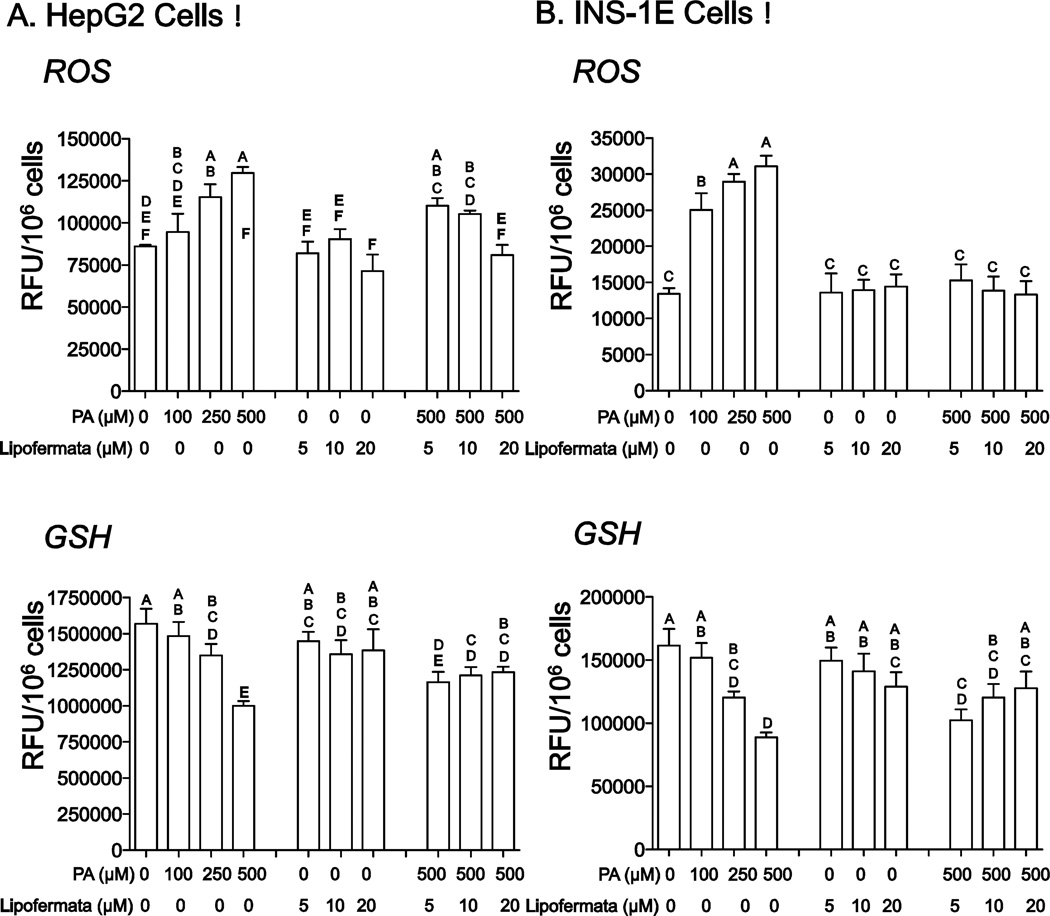
Fig. 9.
Prevention of oxidative stress by Lipofermata. The levels of ROS and GSH were measured after treatment with PA with or without Lipofermata at the concentrations given. (A) HepG2 cells and (B) INS-1E cells. Bar height indicates the mean of 3 experiments. Data were compared using 2-way ANOVA. Levels not connected by the same letter are significantly different at p < 0.001 for each comparison, ROS or GSH versus PA.

