
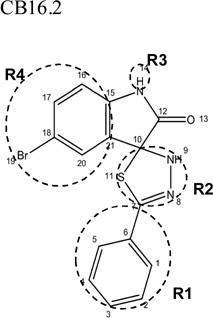
Table 2.
Inhibition of fatty acid transport by Lipofermata/CB16.2 and related compounds
| Structural similarities and differences | Caco2 | HepG2 | Adipocytes | C2C12 | INS-1E | ||||
|---|---|---|---|---|---|---|---|---|---|
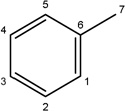
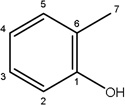
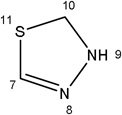
| Name/Designation | R1 | R2 | R3 | R4 | IC50 µM (SEM)a | ||||
 |
 |
 |
-H |  |
6.09±1.00 | 2.74±0.90 | 39.34±9.34 | 5.67±1.35 | 4.65±1.56 |
| CB16.3 | |||||||||
 |
 |
-H |  |
22.08±7.17 | 9.40±2.22 | 30.24±6.41 | 8.95±1.10 | 3.80±0.46 | |
 |
 |
-CH3 |  |
16.33±4.44 | 14.64±4.30 | 27.54±5.99 | 12.89±1.43 | 4.75±0.62 | |
| CB16.5 | |||||||||
 |
 |
-CH3 |  |
56.70±8.83 | 40.00±12.95 | 53.19±16.39 | 30.67±3.76 | 11.27±3.46 | |
| Missing |  |
-H |  |
532.00±250 | 191.20±94 | Not effective | Not Effective |
Not Effective |
|
a
Data derived from log dose response curves analyzed using Prism 5.0. Values indicate the mean ± of three independent experiments.