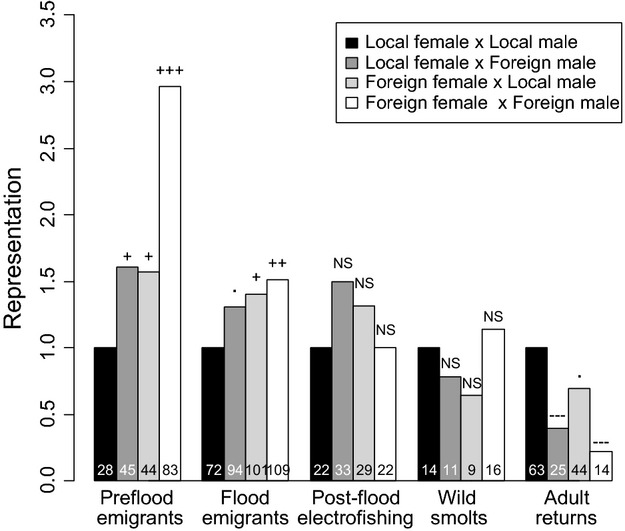
Figure 2.

Representation of each group at each life/sampling stage. Representation values are relative to the Localfemale × Localmale group in each case. Absolute representations (counts per group) are given in the bars. Significance of comparisons (based on G-tests) with Localfemale × Localmale group indicated above bars: NS, nonsignificant; -, significantly less, +, significantly more; ·, 0.1 > P > 0.05; -/+, 0.05 > P > 0.01; –/+=, 0.01 > P > 0.001, —/+++, P < 0.001.
